MTC Akademika Harmonics
Wskaźnik
Wersja 1.0, Jun 2026
Windows, Mac
Trading product for MTC Akademika Harmonics Wskaźnik Fibonacci Key Levels, image 2
Trading product for MTC Akademika Harmonics Wskaźnik Fibonacci Key Levels, image 3
Trading product for MTC Akademika Harmonics Wskaźnik Fibonacci Key Levels, image 4
Od 21/07/2025

Opis


MTC Akademika Harmonics


Harmonic market structure, read through the lens of Leibniz's *Monadology* — in the personal interpretation of David Murawski, der Mustermann.


Short Description

MTC Akademika Harmonics is a chart-overlay built on a single conviction: price is not noise, but a plenum of reflections. Founded on the principles of Gottfried Wilhelm Leibniz's *Monadology* — in the years-long personal interpretation of David Murawski, der Mustermann — it reveals where the market's harmonic structure falls into agreement across every scale, and condenses that reading into one calm, professional dashboard. It is a discretionary analysis and visualization tool, not an automated system or a signal service.


The Idea

In 1714 Leibniz proposed that reality is composed of simple, indivisible units — *monads* — each of which mirrors the whole universe from its own point of view, and that the order we experience arises from a *pre-established harmony* among them. Nothing, he held, exists without its *sufficient reason*.


This indicator applies that worldview to the chart. Every structure, from the faintest swing to the largest movement, is treated as a reflection of one and the same whole — the part contained in the whole, the whole echoed in the part. Meaning is not claimed from any single signal; it emerges in the moments where independent reflections fall into harmony. And no turning point is arbitrary — each carries its reason in the structure that produced it.


It is not a generic pattern scanner. It is one author's distillation of a three-hundred-year-old idea into an instrument that does the watching for you.


What You Get:

- **One coherent read across every scale** — the smallest swing and the largest movement on a single chart, so you see structure instead of clutter.

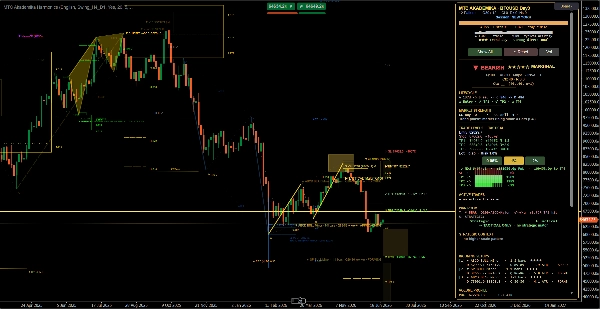
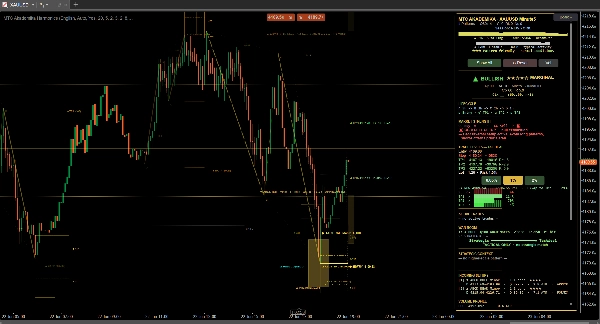
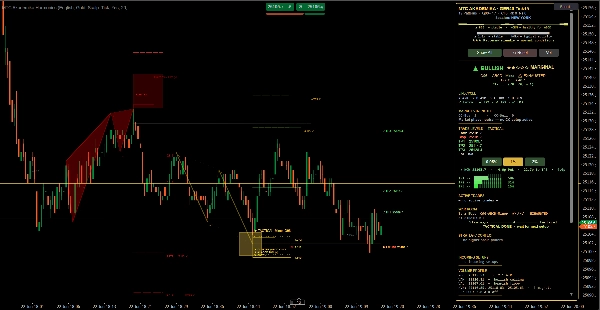
- **Moments of harmony, marked for you** — the rare situations where independent reflections align are surfaced and highlighted, so the strongest context stands out on its own.

- **Complete, readable setups** — for every structure: a clear zone, projected targets and a protective stop, with the reward-to-risk shown at a glance.

- **A professional command-dashboard (War Room / Modern UI)** — direction, conviction, market context and the multi-timeframe picture, condensed into one panel.

- **Lifecycle at a glance** — every structure is tagged *live*, *spent* or *invalid*, so you always know what still deserves your attention and what to ignore.

- **A built-in risk view** — position size from your account size and risk-per-trade, shown in your account currency.

- **Multi-timeframe awareness and alerts** — a higher-timeframe read, plus optional alerts for new structures and key touches.

- **A guided tutorial in seven languages** — it teaches the philosophy and the panel while you use them.


Who It Is For

Discretionary traders who think in structure rather than in indicators; who want a quiet, unified picture instead of a wall of alerts; and who appreciate that the finest instruments hide their machinery and show only what matters.


On the Method

How harmony is measured, how the scales relate, how the reading is formed — these are the fruit of long private research and are, by design, not disclosed. You are acquiring the judgement, not the recipe.


Compatibility

Runs as a chart overlay on **any symbol and any timeframe** (tick charts included). Interface in English, German, Spanish, Italian, French, Russian and Portuguese.


Risk

MTC Akademika Harmonics is a discretionary analysis and visualization tool, not an automated trading system or a signal service. It highlights structure and context; the decision to trade, and the management of risk, remain entirely yours. Trading carries the risk of loss. Past results do not guarantee future results.


Podsumowanie

Profil wskaźnika
Kategoria wskaźnika
Formacja
Typ wyjścia
Wizualizacja
Sygnały
Filtr
Wymagania dotyczące danych
Tylko słupki
Dane tickowe
Wolumen
Obsługiwane sygnały
Przecięcie
Przełamanie
Odwrócenie trendu
Siła trendu
Zmienność
Dotknięcie poziomu
Przebicie poziomu

Opinie klientów

0.0
Opinie: 0
Opinie klientów
Ten produkt nie ma jeszcze opinii. Wypróbowałeś(-aś) go już? Bądź pierwszy(-a) i powiedz o tym innym!

Dyskusja

Częste pytania

Fibonacci
Key Levels
AI-assisted
Market Structure
Risk Dashboard
Support & Resistance
Produkty dostępne za pośrednictwem cTrader Store, w tym boty handlowe, wskaźniki i wtyczki, dostarczane są przez deweloperów zewnętrznych i udostępniane wyłącznie w celach informacyjnych oraz w celu zapewnienia dostępu technicznego. cTrader Store nie jest brokerem i nie zapewnia doradztwa inwestycyjnego, nie udziela spersonalizowanych rekomendacji ani nie gwarantuje przyszłych wyników.

Więcej od tego autora

Wskaźnik
Fibonacci
Key Levels
+1
Draw & learn Elliott, Harmonic, NeoWave manual plotting with built-in rule validator & coach.
Wskaźnik
Key Levels
Market Structure
Hurst cycle map in a clean sub-pane: confirmed trough/crest diamonds per cycle tier, next-low forecast and "Nest of Lows
Wskaźnik
ATR
EMA
+2
Dense EMA rainbow + Pro tools & a tested engine — get more from your EMAs, your research base for EMA bots.

Możesz także polubić

Wskaźnik
BOS
CHOCH
+5
Non-repainting market-structure overlay: liquidity, BOS/CHoCH, contraction zones, HTF bias + machine-readable data outpu

Cena

Od 21/07/2025