


Opis
Główna koncepcja:
Klasyczne miary wsparcia i oporu „reakcji”: ile razy cena się tu odwróciła? CCZ mierzy „akceptację”: jak długo cena zgadzała się tu handlować?
CCZ dokonują uczciwego pomiaru: „Ile świec z rzędu bez przerwy zaakceptowało tę cenę?”
Metoda:
1. Weź wycinek ostatniej ceny i podziel go na cienkie poziome pasma, każde o wysokości około ułamka aktualnego ATR. Traktuj je jak półki.
2. Dla każdego pasma przejdź przez świece i policz najdłuższy nieprzerwany ciąg, którego zakres od high do low przecina to pasmo. Jedna świeca, która nie trafia, kończy serię, a liczenie zaczyna się od nowa od zera.
3. Każde pasmo, którego najlepsza seria przekracza próg — powiedzmy sześć świec (lub ustalony przez użytkownika) — staje się strefą.
Zasada „z rzędu” to cały pomysł. Ściana kolejnych nakładających się świec to konsolidacja — półka wartości uczciwej.
─────────────────────────────────────
│ │ │ │ │ │ │ │
▓ ▓ ▓ ▓ ▓ ▓ ✗ ▓ ▓
1 2 3 4 5 6 miss 1 2
└── 6 z rzędu ──┘ ↑ └ reset serii
kwalifikuje luka
─────────────────────────────────────
Odczytywanie stref
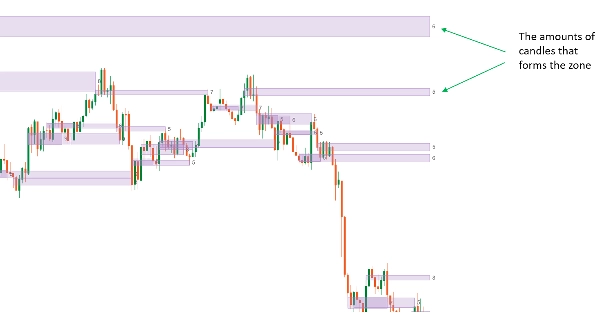
Każda strefa to prostokąt obejmujący pasmo cenowe, z nadrukowaną na nim liczbą. Ta liczba to długość najdłuższego nieprzerwanego ciągu świec, które dotknęły tego pasma — wynik siły strefy. „6” oznacza sześć świec z rzędu dzielących tę cenę; „12” to znacznie bardziej sporny poziom niż „6”.
Prawa krawędź strefy rozciąga się do przodu tak długo, jak pozostaje istotna. Gdy cena oddali się, a potem wróci, strefa jest **złagodzona** — została przetestowana i przestaje się wydłużać. Ty decydujesz, co oznacza „wrócić”:
- „Dotknięcie” — każdy knot powracający do strefy ją łagodzi (surowe)
- „Zamknięcie wewnątrz” — liczy się tylko świeca zamykająca się wewnątrz (łagodne)
- „Dotknięcie, potem zamknięcie wewnątrz” — najpierw knot, potem późniejsza świeca zamykająca się wewnątrz — ignoruje odrzucenia pojedynczym knotem
Opcja ukrywania stref po złagodzeniu utrzymuje wykres tylko na poziomach nadal aktywnych.
Wykrywanie stref na dowolnym bazowym interwale
Liczone świece nie muszą być świecami z twojego wykresu. Ustaw bazowy interwał raz — niższy, równy lub wyższy niż twój wykres — a strefy będą budowane ze świec tego interwału, niezależnie od wykresu, na którym je oglądasz.
Uruchom to na świecach H1 podczas handlu z wykresu M5, a te same strefy zbudowane na H1 pojawią się na obu wykresach. Przybliż na M1, a nadal będą to te same poziomy — patrzysz na powiększony widok jednego wykrywania, a nie inne dla każdego interwału.
Ustawienia
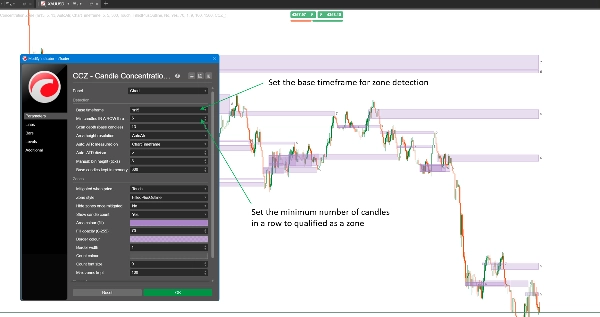
- Bazowy interwał — niezależny od wykresu, dowolna rozdzielczość
- Minimalna liczba świec z rzędu wymagana do zakwalifikowania strefy
- Głębokość skanowania — ile bazowych świec obejmuje okno przesuwne
- Rozdzielczość wysokości obszaru: Auto (na podstawie ATR) lub Ręczna (stałe ticki)
- Tryb automatyczny: mierzenie ATR na interwale wykresu lub bazowym, plus dzielnik ATR do ustawienia, jak ciasne pasmo liczy się jako „ten sam poziom”
- Bazowe świece przechowywane w pamięci
- Zasada łagodzenia: Dotknięcie / Zamknięcie wewnątrz / Dotknięcie, potem zamknięcie wewnątrz
- Styl strefy: tylko obrys, lub wypełniony + obrys, z niezależną przezroczystością wypełnienia
- Ukrywanie stref po złagodzeniu
- Etykieta liczby świec: włącz/wyłącz, kolor, rozmiar czcionki
- Kolor i szerokość obramowania, maksymalna liczba przechowywanych stref, skanowanie słupków wykresu przy ładowaniu
Typowe zastosowanie
Używaj tego jako obiektywnej drugiej opinii na temat własnych wsparć i oporów — poziom pojawia się tylko dlatego, że świece wielokrotnie udowodniły, że ma znaczenie, a nie dlatego, że wygląda ważnie na wykresie.
Ustaw bazowy interwał wyższy niż wykres wejściowy, aby handlować z czystych półek wyższego interwału bez przełączania okien w celu ich znalezienia. Lub dopasuj go do interwału wykresu, aby uzyskać czysty odczyt price action, gdzie obecna sesja jest ciągle odrzucana.
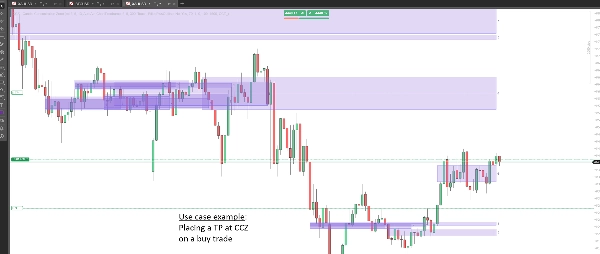
Naturalnie łączy się z osobnym wyzwalaczem wejścia: używaj stref jako swojego nastawienia, gdzie szukać odwrócenia lub wybicia, a własny sygnał do działania. Czasem możesz też odczytać je jako obszar docelowy.
Dla kogo to jest
Dla traderów, którzy już myślą w kategoriach wsparć, oporów lub stref podaży i popytu, i chcą regułowego sposobu na znalezienie silnych stref zamiast oceny wzrokowej szczytów i dołków. Przydatne od interwałów skalpowych po swing trading, na forexie, indeksach, metalach czy kryptowalutach. Zakłada, że masz już sposób na decyzję o wejściach — to narzędzie znajduje poziomy, nie wyzwalacz.
Czego nie robi
- Nie daje sygnałów kupna ani sprzedaży, ani cen wejścia, stopu czy celu
- Nie składa zleceń i nie ma dostępu do twojego konta — wskaźnik działa bez żadnych uprawnień
- Nie ma alertów ani powiadomień
- Nie przemalowuje historii: liczone są tylko zamknięte świece, a liczba siły strefy nigdy się nie zmienia po fakcie. Jej prawa krawędź nadal się wydłuża z każdą świecą, dopóki strefa nie zostanie złagodzona — to strefa pozostaje aktywna, a nie przeszłość jest przerysowywana
Warto wiedzieć
Jeśli ustawisz bazowy interwał wyższy niż wykres, przełącz „ATR mierzony na” również na bazowy interwał. Pozostawienie na interwale wykresu mierzy świecę wyższego interwału mniejszą miarą, co powoduje, że pasmo cenowe jest zbyt wąskie, a strefy zbyt rzadkie do powstania.
Strefę można uznać za złagodzoną dopiero po tym, jak cena najpierw ją opuści, a potem wróci — strefa w trakcie formowania nie może być złagodzona na swojej pierwszej świecy.
Bazowe świece wyższego interwału zaczynają się od czasu serwera twojego brokera. Dwóch brokerów może legalnie dzielić tę samą świecę wyższego interwału w różnych punktach, więc strefy na tym samym symbolu mogą się nieznacznie różnić między brokerami. To cecha danych, a nie wada wskaźnika.
Trading wiąże się z ryzykiem. Wyniki historyczne nie gwarantują wyników przyszłych.
Podsumowanie
Key features include:
- Detection of zones from any user-defined base timeframe, independent of the chart timeframe, allowing higher timeframe zones to be viewed on lower timeframe charts.
- Zones are displayed as rectangles with a strength score indicating the longest consecutive candle count overlapping the zone.
- Mitigation rules determine when a zone is considered tested and no longer extends forward, with options for strict or lenient definitions based on candle touches or closes.
- Customizable settings such as minimum candles in a row, scan depth, band height resolution, zone style, and label display.
- Designed for traders who use support, resistance, or supply and demand concepts and want an objective, rule-based method to identify strong levels.
- Supports markets including forex, indices, metals, and crypto across scalping to swing trading timeframes.
- The indicator does not provide trade signals, alerts, or order execution capabilities and does not repaint historical data.
CCZ serves as a tool to objectively highlight price consolidation zones that can be used as bias areas for potential reversals or breakouts.
Opinie klientów
Dyskusja
Częste pytania
Więcej od tego autora

















Cena