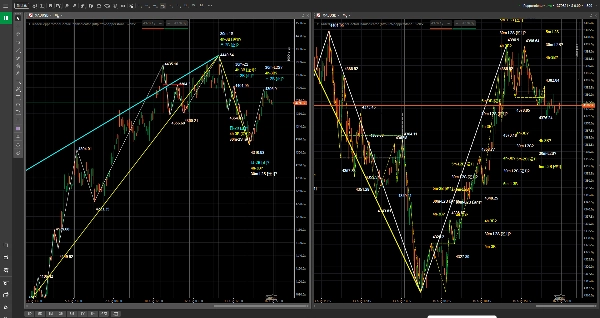
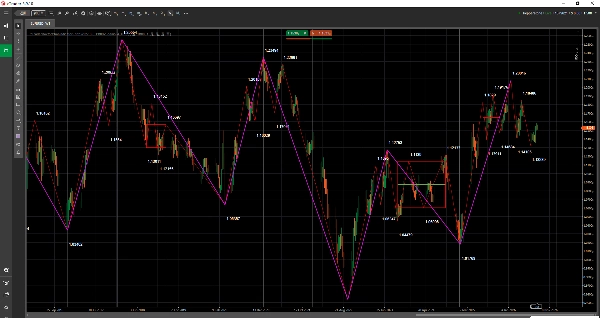
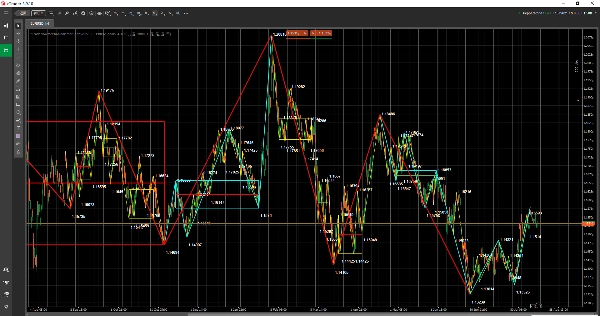
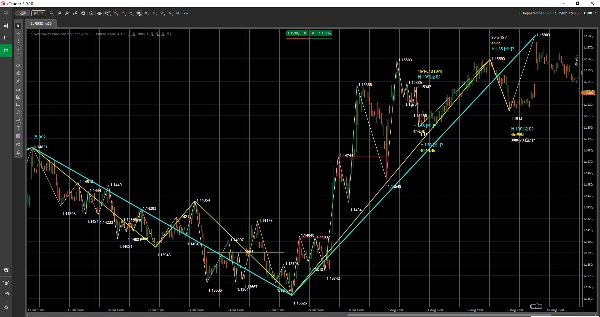
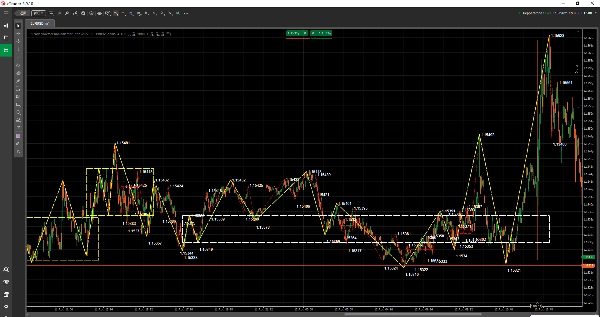
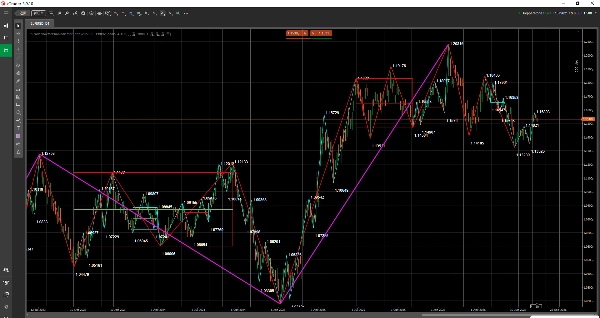
Opis
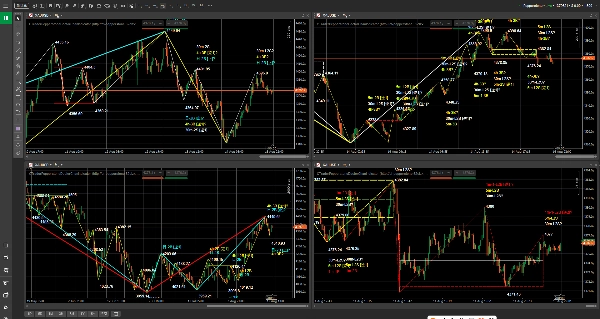
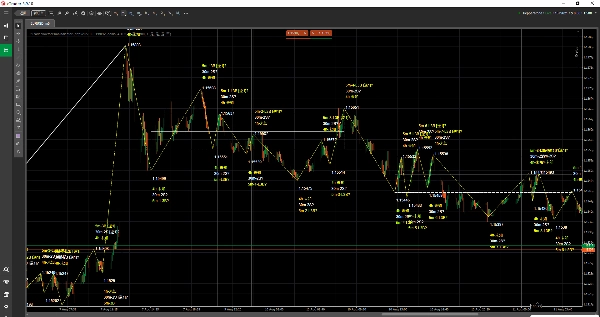
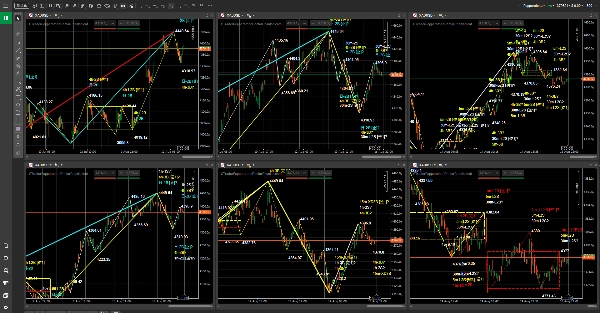
Wskaźnik struktury Boshi Chanlun dla cTrader to wskaźnik analizy technicznej nakładany na wykres, służący do wyświetlania struktur Chanlun na wykresach cTrader.
Jest odpowiedni dla traderów skupiających się na ruchu cen, strukturze trendu oraz analizie wielookresowej. Wskaźnik wyświetla kluczowe struktury Chanlun jako obiekty na wykresie, w tym struktury Bi, strefy Zhongshu, markery kupna/sprzedaży i inne, pomagając użytkownikom intuicyjniej obserwować rytm rynku, zmiany strukturalne oraz zależności między różnymi ramami czasowymi.
Ten wskaźnik nie jest zautomatyzowanym robotem handlowym ani usługą sygnałów handlowych. Jego celem jest pomoc użytkownikom w czytaniu wykresów, przeglądaniu rynków oraz bardziej klarownym tworzeniu planów handlowych.
Obecna wersja jest kompatybilna z określonymi symbolami i ramami czasowymi Pepperstone cTrader. Produkt ten jest niezależnym wskaźnikiem stron trzecich i nie jest oficjalnym produktem Pepperstone ani produktem partnera Pepperstone.
Przegląd wskaźnika
- Typ wskaźnika: wskaźnik struktury rynku / nakładka na wykres.
- Preferowane instrumenty: określone symbole Forex, indeksów, towarów, kryptowalut i CFD na akcje w Pepperstone cTrader.
- Preferowane ramy czasowe: 1 minuta, 5 minut, 15 minut, 30 minut, 1 godzina, 4 godziny, dzienny, tygodniowy i miesięczny.
- Zastosowanie handlowe: obserwacja struktury wykresu, analiza wielookresowa, przygotowanie i wsparcie przeglądu planu handlowego.
Co można zobaczyć na wykresie
- Struktury Bi: służą do obserwacji rytmu huśtawki i postępu strukturalnego.
- Strefy Zhongshu: służą do obserwacji ważnych obszarów konsolidacji, równowagi i nakładania się struktur.
- Markery kupna/sprzedaży: pomagają zlokalizować kluczowe punkty odniesienia struktury.
- Etykiety tekstowe, linie poziome, linie pionowe, obszary prostokątne, linie trendu i inne obiekty wykresu.
- Domyślnie obsługiwane jest automatyczne dopasowanie danych do aktualnej ramy czasowej wykresu, co ułatwia obserwację wielookresową.
Dla kogo jest ten wskaźnik
- Użytkownicy uczący się lub korzystający z wskaźnika Boshi Chanlun Structure Indicator i analizy struktury Chanlun.
- Użytkownicy chcący oglądać informacje o strukturze bezpośrednio na wykresach cTrader.
- Użytkownicy korzystający z Pepperstone do przeglądania Forex, indeksów, towarów, kryptowalut lub CFD na akcje.
- Traderzy potrzebujący porównywać struktury trendów w różnych ramach czasowych.
- Użytkownicy chcący uczynić proces czytania wykresów, planowania i przeglądu bardziej przejrzystym.
Dostęp i licencjonowanie
Dostęp do produktu i licencjonowanie są zarządzane poprzez proces zakupu, wersji próbnej i instalacji w sklepie cTrader. Proszę odnieść się do statusu zakupu, statusu wersji próbnej oraz informacji o produkcie wyświetlanych na stronie produktu w sklepie cTrader.
Obecnie obsługiwane symbole Pepperstone
Forex:
GBPUSD, EURUSD, USDJPY, USDCHF, AUDUSD, USDCAD, GBPJPY
Indeksy:
US500, NAS100, GER40, UK100, JPN225, VIX, HSTECH
Towary:
XAUUSD, XAGUSD
Kryptowaluty:
BTCUSD, ETHUSD
Akcje:
AAPL.US-24, MSFT.US-24, GOOG.US-24, AMZN.US-24, TSLA.US-24, NVDA.US-24, META.US-24, NFLX.US-24, JPM.US-24
Obsługiwane ramy czasowe
1 minuta, 5 minut, 15 minut, 30 minut, 1 godzina, 4 godziny, dzienny, tygodniowy i miesięczny.
Sugerowany sposób pracy
1. Otwórz wykres dla obsługiwanego symbolu w środowisku Pepperstone cTrader.
2. Załaduj wskaźnik Boshi Chanlun Structure Indicator na wykres.
3. Czas danych wskaźnika Boshi Chanlun Structure Indicator to UTC+0. Podczas sprawdzania struktur wykresu upewnij się, że zmieniłeś strefę czasową wykresu cTrader na odpowiednią strefę czasową przed porównaniem pozycji.
4. Upewnij się, że aktualna rama czasowa wykresu jest obsługiwana. Wskaźnik automatycznie dopasowuje dane do ramy czasowej wykresu.
5. Włącz lub wyłącz opcje "Pokaż Bi", "Pokaż Zhongshu" i "Pokaż Kupno/Sprzedaż" według potrzeb.
6. Obserwuj strukturę wykresu wraz z własnym planem handlowym, zarządzaniem pozycją i kontrolą ryzyka.
Ustawienia parametrów
Obecna wersja udostępnia tylko następujące 3 widoczne parametry w panelu wskaźnika cTrader. Ramy czasowe danych, sufiks symbolu brokera, pamięć podręczna, odświeżanie, skompresowany transfer i ustawienia logowania są zarządzane wewnętrznie przez wskaźnik i nie wymagają konfiguracji do normalnego użytkowania.
Pokaż Bi
Wartość domyślna: "true"
Czy wyświetlać struktury Bi.
Pokaż Zhongshu
Wartość domyślna: "true"
Czy wyświetlać strefy Zhongshu.
Pokaż Kupno/Sprzedaż
Wartość domyślna: "true"
Czy wyświetlać markery kupna/sprzedaży.
Ważne uwagi
- Ten produkt jest wskaźnikiem pomocniczym analizy technicznej, a nie zautomatyzowanym robotem handlowym.
- Wskaźnik nie składa automatycznie zleceń.
- Wskaźnik nie stanowi porady inwestycyjnej, usługi sygnałów handlowych ani gwarancji zysku.
- Obecna wersja jest kompatybilna tylko z określonymi symbolami Pepperstone cTrader i określonymi ramami czasowymi.
- Czas danych wskaźnika Boshi Chanlun Structure Indicator to UTC+0. Podczas wyświetlania na wykresie cTrader proszę przełączyć się na odpowiednią strefę czasową wykresu przed sprawdzeniem pozycji struktur.
- Użytkownicy powinni korzystać z niego razem z własnym planem handlowym, zarządzaniem pozycjami, kontrolą ryzyka i niezależnym osądem.
Kierunek przyszłych aktualizacji
Obecna wersja priorytetowo traktuje określone symbole i ramy czasowe Pepperstone cTrader. Przyszłe aktualizacje mogą rozszerzyć zakres obsługi o więcej brokerów, więcej mapowań symboli oraz bardziej kompletny zakres usług danych zgodnie z planem produktu.
Ostrzeżenie o ryzyku
Handel na rynkach finansowych wiąże się z ryzykiem. Wyniki historyczne nie gwarantują przyszłych rezultatów. Ten wskaźnik jest jedynie narzędziem pomocniczym do analizy technicznej i nauki. Nie stanowi porady inwestycyjnej, usługi sygnałów handlowych ani gwarancji zysku. Struktury historyczne nie odzwierciedlają wyników przyszłych. Użytkownicy powinni dokładnie przetestować go we własnym środowisku handlowym i stosować ostrożnie wraz z zasadami zarządzania ryzykiem.
Podsumowanie
Compatible with selected Forex pairs (e.g., GBPUSD, EURUSD), indices (e.g., US500, NAS100), commodities (XAUUSD, XAGUSD), cryptocurrencies (BTCUSD, ETHUSD), and major US stock CFDs (e.g., AAPL, MSFT, TSLA), it automatically matches data to the current chart timeframe. Users can toggle the display of Bi structures, Zhongshu zones, and buy/sell markers via simple parameters.
This indicator serves as a chart reading and market review assistant, not an automated trading system or signal provider. It requires users to apply their own trading plans, risk management, and judgment. Data time is based on UTC+0, so chart time zone adjustments are necessary for accurate structure positioning. Access and licensing are managed through the cTrader Store.
Opinie klientów
5 | 0 % | |
4 | 100 % | |
3 | 0 % | |
2 | 0 % | |
1 | 0 % |












![Logo „[Stellar Strategies] BOS Trend 1.0”](https://cdn.ctrader.com/image/webp/6cdec0f1-0e97-4a82-a8a4-2b67aed54d38_25695)