present
Zarejestruj się i otrzymaj 50 $ zniżki na pierwszy zakup
Trading product for TradeLens Wskaźnik Chart UI Tools Key Levels, image 1
TradeLens
Wskaźnik
Wersja 1.3, Sep 2026
Windows, Mac
5.0
Opinie: 1
Trading product for TradeLens Wskaźnik Chart UI Tools Key Levels, image 2
Trading product for TradeLens Wskaźnik Chart UI Tools Key Levels, image 3
Trading product for TradeLens Wskaźnik Chart UI Tools Key Levels, image 4
Trading product for TradeLens Wskaźnik Chart UI Tools Key Levels, image 5
Trading product for TradeLens Wskaźnik Chart UI Tools Key Levels, image 6
Trading product for TradeLens Wskaźnik Chart UI Tools Key Levels, image 7
Trading product for TradeLens Wskaźnik Chart UI Tools Key Levels, image 8
Trading product for TradeLens Wskaźnik Chart UI Tools Key Levels, image 9
Trading product for TradeLens Wskaźnik Chart UI Tools Key Levels, image 10
Trading product for TradeLens Wskaźnik Chart UI Tools Key Levels, image 11
Od 09/02/2026
26
Sprzedaż
167
Bezpłatne instalacje

Opis

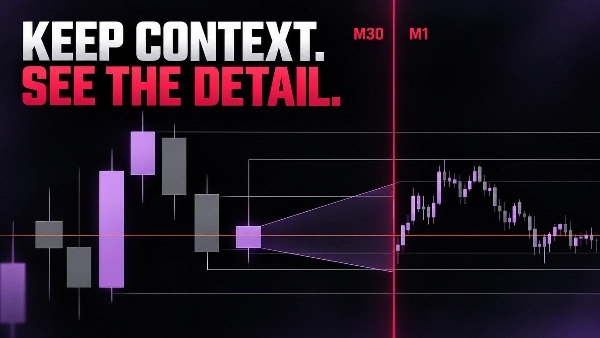
TRADELENS - ZACHOWAJ KONTEKST. ZOBACZ SZCZEGÓŁY.

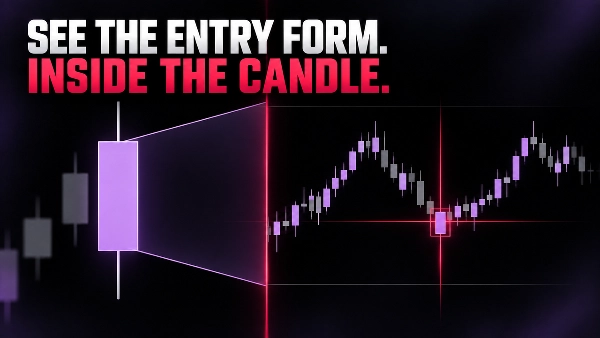
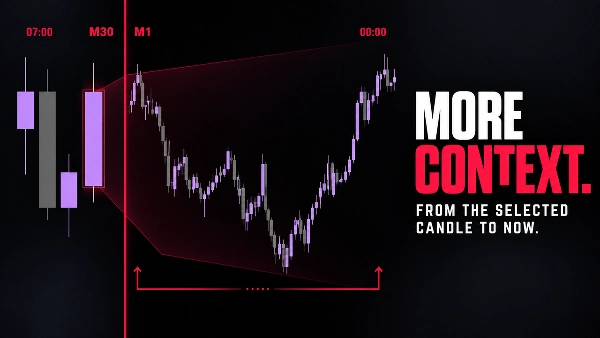
TradeLens umieszcza kompaktowy widok świecy z niższego interwału czasowego bezpośrednio w Twoim aktualnym wykresie. Oryginalny wykres pozostaje Twoim kontekstem z wyższego interwału czasowego; panel szczegółów pokazuje, jak cena rozwija się wewnątrz wybranej świecy kontekstowej.

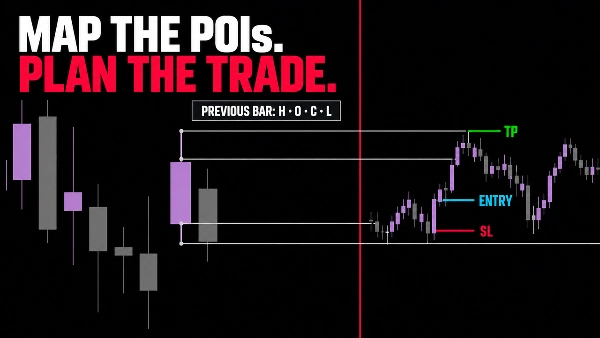
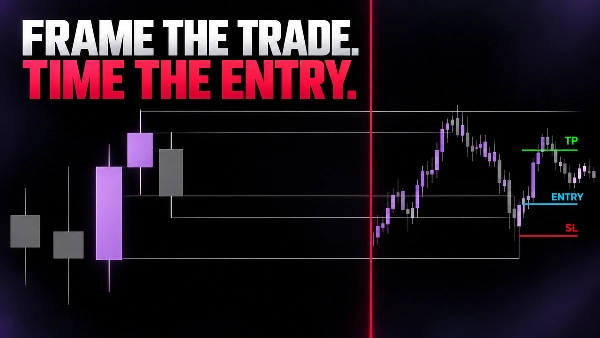
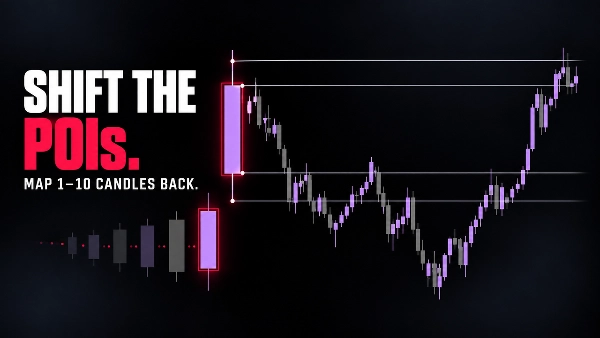
Domyślnie używaj aktualnie formującej się świecy lub cofnij się, aby zbadać wcześniejszą świecę kontekstową. Możesz oprawić aktywną konfigurację za pomocą opcjonalnych POI (promieni) na poziomach High, Low, Open i Close poprzedniego zamkniętego słupka, a następnie analizować ruch na niższym interwale czasowym bez opuszczania wykresu.

CO POMAGA ZOBACZYĆ TRADELENS

  • Struktura z wyższego interwału czasowego i szczegóły z niższego interwału w tym samym oknie.
  • Postęp aktualnej świecy kontekstowej w bardziej szczegółowej skali.
  • Punkty zainteresowania OHLC poprzedniego słupka na całym wykresie.
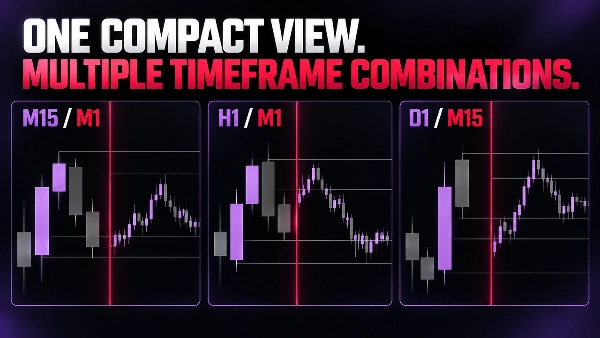
  • Kompaktowe kombinacje takie jak M15/M1, M30/M1, H1/M1, D1/M15 i D1/M30.
  • Czystszy sposób na dopracowanie momentu wejścia przy zachowaniu kontekstu.
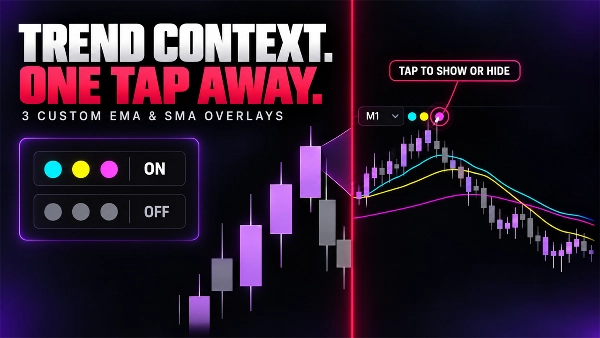
  • Dodaj do trzech konfigurowalnych nakładek EMA lub SMA.
  • Pokaż lub ukryj każdą średnią natychmiast za pomocą sterowania jednym dotknięciem.
  • Zobacz kierunek trendu bezpośrednio w widoku niższego interwału czasowego.

PROSTE, WIZUALNE STEROWANIE

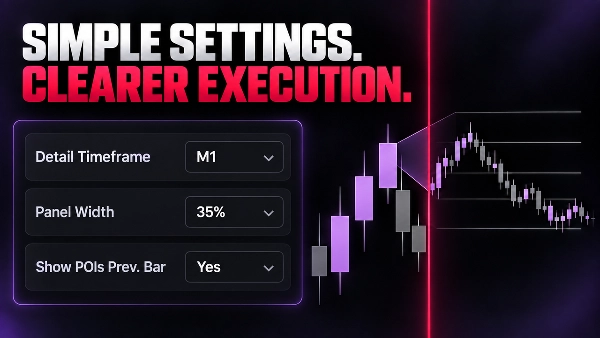
  • Interwał czasowy szczegółów i przesunięcie świecy kontekstowej.
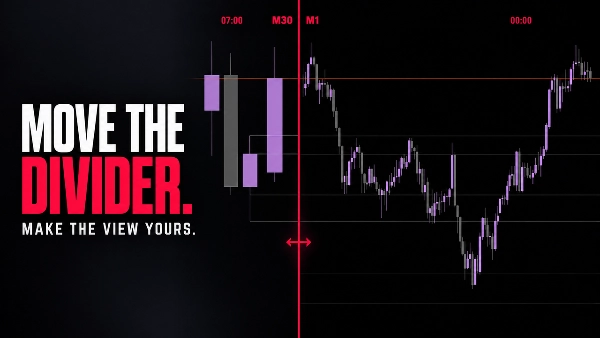
  • Szerokość panelu szczegółów, tło i przezroczystość.
  • Kolory byka, niedźwiedzia, separatora i etykiet.
  • Opcjonalne POI poprzedniego słupka z konfigurowalnym kolorem i grubością.

Interwał czasowy szczegółów musi być mniejszy niż interwał czasowy wykresu. Jeśli kombinacja jest nieprawidłowa, TradeLens ukrywa swoją wizualizację i wyświetla wyraźny baner konfiguracyjny.

TradeLens to narzędzie do analizy wizualnej. Nie składa, nie modyfikuje ani nie zarządza zleceniami. Przykłady pokazane w galerii ilustrują sposób czytania wykresów i nie są rekomendacjami handlowymi ani gwarancjami wyników.


Podsumowanie

AI summary
TradeLens is a chart visualization tool designed to integrate two timeframes within a single trading chart. It embeds a compact lower-timeframe candle view inside the current higher-timeframe chart, allowing traders to observe detailed price action within the context of a broader market structure. Users can analyze the progression of the current or previous context candles at a finer scale without switching charts.

Key features include optional points of interest (POIs) marking the previous bar’s Open, High, Low, and Close levels, customizable visual settings such as detail panel size, background opacity, and color schemes for bullish, bearish, and separator elements. TradeLens supports common timeframe combinations like M15/M1, M30/M1, H1/M1, D1/M15, and D1/M30, ensuring the detail timeframe is always smaller than the context timeframe.

This tool facilitates refined entry timing by preserving higher-timeframe context while providing granular lower-timeframe insights. It is a visual analysis indicator and does not execute or manage trades. TradeLens is tagged under market structure and chart UI tools, supporting analysis related to key levels, liquidity sweeps, market structure changes, and inducements.
Profil wskaźnika
Kategoria wskaźnika
Struktura rynku (SMC)
Typ wyjścia
Wizualizacja
Wymagania dotyczące danych
Tylko słupki

Opinie klientów

5.0
Opinie: 1
5
100 %
4
0 %
3
0 %
2
0 %
1
0 %
Opinie klientów
October 4, 2026
TradeLens displayed an embedded M1 candle view on EURUSD H1 and XAUUSD H1, M10 and Month1. Three moving averages, timeframe labels and the separator were visible. The invalid M1/M1 combination correctly triggered a clear warning. The interface works well, although low contrast and compressed detail candles can affect readability, especially on higher timeframes.

Dyskusja

Częste pytania

Chart UI Tools
Key Levels
Liquidity Sweep
CHOCH
Inducement
Market Structure
Liquidity Grab
Produkty dostępne za pośrednictwem cTrader Store, w tym boty handlowe, wskaźniki i wtyczki, dostarczane są przez deweloperów zewnętrznych i udostępniane wyłącznie w celach informacyjnych oraz w celu zapewnienia dostępu technicznego. cTrader Store nie jest brokerem i nie zapewnia doradztwa inwestycyjnego, nie udziela spersonalizowanych rekomendacji ani nie gwarantuje przyszłych wyników.

Więcej od tego autora

Wskaźnik
BOS
CHOCH
+5
Spot market structure shift with ease, overlay timeframes, avoid false breakouts with open close pivots, hide chart bars
Wskaźnik
Volume
Imbalance
+5
Spot Institutional Order Flow with Proportional Volume Bubbles & Integrated Cumulative Volume Delta (CVD) Intelligence.
Wskaźnik
Forex
EURUSD
+5
Fimathe Indicator - Fimathe PCM - Automated Trend Channels & Levels — Ideal for live trading and backteting
Logo „ZigXRay”
Najwyżej oceniane
4.6
(5)
$29
/
$49
Wskaźnik
CHOCH
Key Levels
+5
ZigZag Market Structure Identifier - Multi-Layer Scanner: Convergent Pivot Detection, 4-TF Overlay & Naked Chart Mode.
Wtyczka desktopowa
Risk/Reward
Trade Journal
+5
cTrader Journal - Automatic Trade Capture. Offline Reviews. No Subscription.
Logo „DrbcLevels”
Najwyżej oceniane
4.0
(4)
$19
/
$29
Wskaźnik
Key Levels
Break & Retest
+5
Premium Discount Levels - Professional Dealing Range Zones with Draggable Lines, Alerts, Wartermark & Backtest Mode.
cBot
Fixed Lot
TP Manager
+5
Hotkeys Trading Assistant - Professional Shortcut Assitant with Risk Manager, Hotkeys & Lot Sizing.
Logo „fvg_levels”
Najwyżej oceniane
4.0
(4)
$19
/
$29
Wskaźnik
Key Levels
Order Block
+5
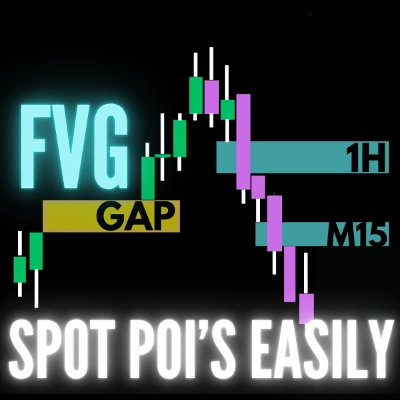
FVG Levels — Auto-Detection of Multi-Timeframe Fair Value Gaps & GAPs, Smart Filters and Liquidity Zone Monitoring

Możesz także polubić

Wskaźnik
Forex
BTCUSD
+5
Buy-Side & Sell-Side Liquidity (BSL/SSL) Indicator
Logo „QX TradeDecision”
Najwyżej oceniane
4.5
(4)
$20
/
$22
Wskaźnik
ATR
Flag
+5
Decision panel with Buy/Sell scores, market bias, setup quality, trading cost and clear trade reasons.
Wskaźnik
cTreder Smart SMA
Wskaźnik
Prop
Forex
+12
Identify and trade breakouts with Consolidation Zones! Visualize price consolidation areas for trading opportunities.
Wskaźnik
VWAP
Volume
+2
Dynamic VWAP with ±1/±2 Standard Deviation Bands for intraday volatility, extremes and mean reversion.
Wskaźnik
Grid
Prop
+14
Visualize trends with Standard Deviation Channel! Display median, and add customizable upper/lower deviation channels.
Wskaźnik
Supply & Demand
Support & Resistance
RAF Supply Demand Lite v1.0 automatically detects clean Supply and Demand zones using confirmed swing highs and lows. Zo
Wskaźnik
Forex
Detects valid Fair Value Gaps from strong 3-bar patterns. Keep drawing unfilled gaps until price fills them.
Wskaźnik
ATR
RSI
+1
Super Trend Rsi ,ATR + trend change distance + dynamic Alpha, divergence/convergence
Wskaźnik
RSI
RSI on the main chart with 45/55 momentum levels, overbought/oversold levels, averaged RSI, and multi-timeframe support.
Wskaźnik
Imbalance
Fair Value Gap
+1
Multi-symbol, multi-timeframe Fair Value Gaps in one panel.
Wskaźnik
Key Levels
Order Block
+5
Order blocks, fair value gaps, liquidity sweeps and a 24-timeframe signal scanner on one chart.
Wskaźnik
MACD
Prop
+14
Customize the MACD! Choose colors, get real-time tick updates, and see crossover points for enhanced trading precision.
Wskaźnik
BOS
MSS
+3
Advanced indicator to highlight key execution context and help aligning structure, location, and risk.
Wskaźnik
AI-assisted
Order Block
+5
The daily bias estimator indicator uses ICT concepts to show whether the chart is bullish or bearish on multi-time frame
Wskaźnik
ATR
Prop
+14
Optimize exits with Chandelier Exit! Visualize stop-loss points dynamically for improved trading precision and safety.
Wskaźnik
Shows BUY & SELL signals for 3 & 4 BAR PATTERN (Morning star/ Evening star). It is adjustable and it will SHOW ARROWS.
Wskaźnik
Volume
Key Levels
+1
Fixed-grid volume profile: bull and bear volume at every price level, with Point of Control and value area.

Cena

Od 09/02/2026
26
Sprzedaż
167
Bezpłatne instalacje