
PDHL
Wskaźnik
1.85K pobrania
Wersja 1.0, Sep 2024
Windows, Mac
2.5
Opinie: 2
Opis
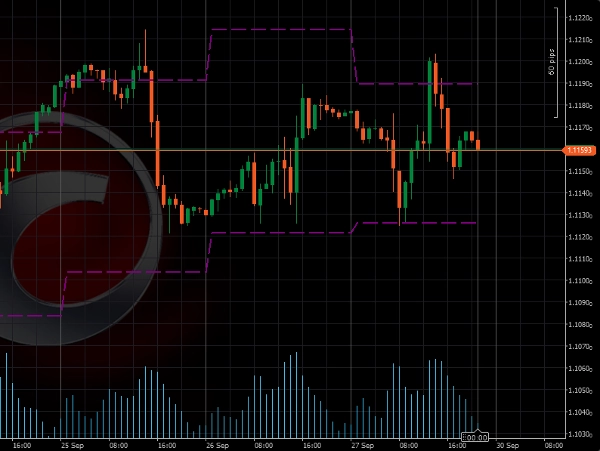
Wprowadzenie wskaźnika handlu High-Low
Ten wskaźnik został zaprojektowany do automatycznego nanoszenia na wykres najwyższych i najniższych poziomów cen z poprzedniego dnia. To narzędzie pomaga szybko zidentyfikować kluczowe poziomy dla potencjalnych wybicia i odwróceń.
Kluczowe korzyści:
- Idealny do handlu wybiciami: Ten wskaźnik podkreśla krytyczne poziomy cen z poprzedniego dnia, które często są używane jako punkty odniesienia dla strategii wybicia. Handel wybiciami powyżej lub poniżej tych poziomów może oferować wysokopotencjalne ustawienia.
- Prosty, ale skuteczny: Wskaźnik handlu High-Low koncentruje się na jednym z najważniejszych aspektów ruchu cen – najwyższym i najniższym poziomie z poprzedniego dnia. Włączając te poziomy do swojej strategii, zyskujesz jaśniejsze pojęcie o strukturze rynku i potencjalnych punktach zwrotnych.
Uwaga:
- Najlepiej używać na interwałach krótszych niż 1 dzień
Ustawienia:
- Uwzględnij niedzielę: domyślnie = nie
Podsumowanie
Podsumowanie AI
The PDHL (Previous Day High & Low) indicator automatically plots the prior day's highest and lowest price levels on trading charts. It is designed to assist traders in identifying key price levels that may signal potential breakouts or reversals. By highlighting these critical levels, the indicator supports breakout trading strategies, providing reference points for entering trades when price moves above or below the previous day's range. The tool emphasizes simplicity and effectiveness by focusing on essential price action elements, helping traders better understand market structure and potential turning points. It is best used on intraday timeframes shorter than one day. A configurable setting allows users to include or exclude Sunday in the calculation, with the default setting excluding it.
Profil wskaźnika
Opinie klientów
2.5
Opinie: 2
5 | 0 % | |
4 | 0 % | |
3 | 50 % | |
2 | 50 % | |
1 | 0 % |
Opinie klientów
October 9, 2025
What Timezone is it in at default? It seems to fail to get the accurate Highs and lOws for different istruments. You could add that as a customisable input. Please add closing price too
July 9, 2025
Pros: Simple and clear display of previous day's high/low levels. Stable performance. Easy to use and customize. Cons: No breakout alerts. No visual zone fill option. Lacks additional filters or Fibo levels.
Dyskusja
Częste pytania
Breakout
Produkty dostępne za pośrednictwem cTrader Store, w tym boty handlowe, wskaźniki i wtyczki, dostarczane są przez deweloperów zewnętrznych i udostępniane wyłącznie w celach informacyjnych oraz w celu zapewnienia dostępu technicznego. cTrader Store nie jest brokerem i nie zapewnia doradztwa inwestycyjnego, nie udziela spersonalizowanych rekomendacji ani nie gwarantuje przyszłych wyników.
Więcej od tego autora


![Logo „[Stellar Strategies] MARSI Signal Plotter”](https://cdn.ctrader.com/image/webp/7b2b8da6-8f8e-4646-8d4a-4710c516c01e_25567)


Cena
Od 24/09/2024
4.49K
Bezpłatne instalacje