Trading product for TradingV Fixed Range Volume Profile Indicator Key Levels Volume, image 1
Indicator
Version 1.1, May 2026
Windows, Mac
Trading product for TradingV Fixed Range Volume Profile Indicator Key Levels Volume, image 2
Trading product for TradingV Fixed Range Volume Profile Indicator Key Levels Volume, image 3
Since 02/01/2025

Description

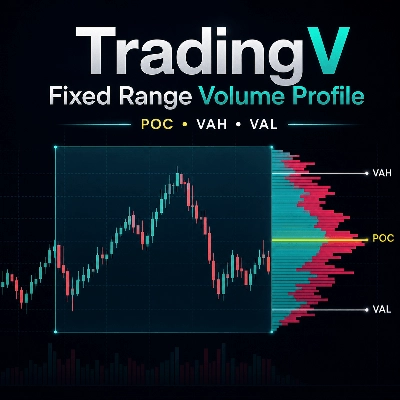
TradingV Fixed Range Volume Profile is a professional volume profile tool designed to help traders analyze where trading activity is concentrated inside a selected price range.


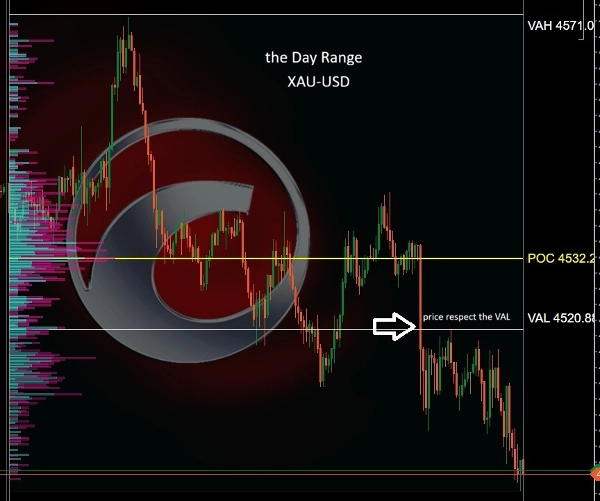
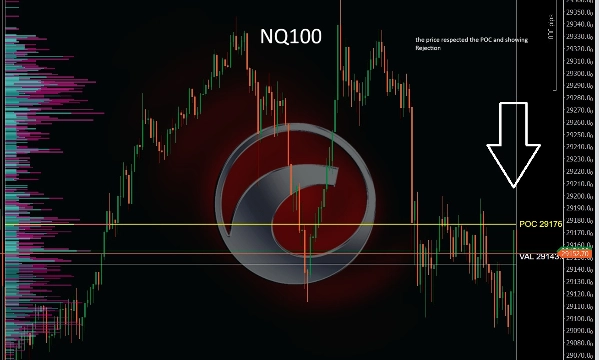
The indicator displays the volume distribution of the chosen range and highlights the most important market structure levels: POC, VAH, and VAL. These levels help traders identify high-liquidity zones, fair value areas, potential support and resistance, and important reaction zones for entries, exits, and trade management.


Volume Profile is widely used by professional traders, and many successful trading strategies are built around understanding where volume has accumulated, where price is accepted, and where price may reject. The POC can act as a major reference point for market balance, while VAH and VAL help define the upper and lower boundaries of the value area.


How to use the inputs:


Range Mode:

Choose how the profile range is selected.

- SessionToday: automatically starts from the defined session start time and continues to the latest available candle.

- ManualTime: allows you to manually set the exact Start Time and End Time for the profile.

- VisibleRange: calculates the profile based on the currently visible chart range.


Session Start Hour / Session Start Minute:

Used with SessionToday mode to define the start of the trading session. For example, if your market session starts at 01:05, set the hour to 1 and the minute to 5.


Start Time / End Time:

Used with ManualTime mode to define a custom fixed range. If End Time is left empty, the indicator uses the latest available candle.


Color Settings:

Customize the up-volume color, down-volume color, POC color, VAH/VAL color, range box opacity, profile opacity, and value area opacity to match your chart style.


Typical use cases:

- Finding key liquidity zones inside a session

- Identifying value area boundaries

- Planning entries near POC, VAH, or VAL

- Managing exits around important volume levels

- Comparing current price location against accepted value

- Supporting price action, intraday, scalping, and swing trading decisions


This indicator is suitable for traders who use volume profile, market structure, auction market theory, support and resistance, or liquidity-based trading methods. It is designed to give a clean visual view of where the market has traded the most volume inside a fixed range.


Note:

TradingV Fixed Range Volume Profile is an analytical tool and does not provide buy or sell signals by itself. It should be used together with your own trading plan, risk management, and market confirmation.

Summary

AI summary
TradingV Fixed Range Volume Profile is a volume profile indicator that visualizes the distribution of traded volume within a user-selected price range. It highlights key market structure levels including the Point of Control (POC), Value Area High (VAH), and Value Area Low (VAL). These levels assist traders in identifying high-liquidity zones, fair value areas, and potential support and resistance, aiding in entry, exit, and trade management decisions.
The indicator offers flexible range selection modes:
- SessionToday, which automatically sets the range from a defined session start time to the latest candle;
- ManualTime, allowing custom start and end times;
- VisibleRange, which uses the currently visible chart area.
Users can customize colors for up-volume, down-volume, POC, VAH/VAL, and adjust opacity settings to fit their chart style. Typical applications include locating key liquidity zones, defining value area boundaries, and supporting various trading styles such as intraday, scalping, and swing trading.
TradingV Fixed Range Volume Profile is designed for traders employing volume profile, market structure, auction market theory, or liquidity-based methods. It provides a clear visual representation of volume concentration but does not generate buy or sell signals independently.

Indicator profile
Indicator category
Volume
Output type
Visualisation
Data requirements
Volume
Tick data
Supported signals
Level touch
Level break

Customer reviews

0.0
Reviews: 0
Customer reviews
No reviews for this product yet. Already tried it? Be the first to tell others!

Discussion

FAQ

Key Levels
Volume
Market Structure
Support & Resistance
Products available through cTrader Store, including trading bots, indicators and plugins, are provided by third-party developers and made available for informational and technical access purposes only. cTrader Store is not a broker and does not provide investment advice, personal recommendations or any guarantee of future performance.

You may also like

Indicator
EMA
RSI
+5
MACD Colour Histogram with 11 Moving Average Types, Multi-timeframe confirmation and Sound Signal Alert.
Indicator
EURUSD
GBPUSD
+3
All-in-one suite for ICT concepts: NY Midnight Open, Killzones, automatic Liquidity levels (PDH/L, PWH/L).
Indicator
VWAP
Volume
+4
Volume Profile + VWAP with Standard Deviations
Indicator
ADX
ATR
+2
Quantum Breakout Pro Professional Breakout Indicator for cTrader
Indicator
MSS
Key Levels
+2
Maps equal highs, equal lows and active liquidity pools directly on your cTrader chart.
Indicator
Forex
Indices
+1
Detects HTF bias using CRT, Expansion & Swing Point patterns with SMT/PSP divergence — visualised in a floating candle
Indicator
SMC
Prop
+4
📈 Trading Sessions Indicator — London, New York & Tokyo Visualize Key Market Sessions + High/Low Levels with Precision
Indicator
Prop
Forex
+14
Stochastic Momentum Index (SMI) for cTrader optional higher-timeframe source, and clear overbought/oversold levels.
Indicator
VWAP
Moving Average
Vwap Bands it is highly sought after by professional traders because it includes Standard Deviation Bands
Indicator
Prop
Forex
+14
🚀See the market’s framework, decide faster. Session-Aware Pivots. Auto Presets. Pro-Grade Zones.🚀
Indicator
Prop
Scalping
Shows bars from different Time Frame on zoom out and hides the current bars. Perfect tool for Multi TF "Market Reply"
Indicator
SMC
Forex
+5
Detect institutional breakout zones with smart volume & channel analysis — by PrimeQuant.
Indicator
ATR
A lightweight Multi Time Frame bias dashboard for quickly spotting market direction across multiple timeframes.
Indicator
Breakout
FlexSR auto‑detects pivot highs/lows to plot dynamic support & resistance lines Features customizable styling and option
Indicator
Prop
Forex
+9
Average Cost Price helps you keep track of your open positions on the chart. In doing so, it provides lines and explanat
Indicator
News Filter
External Data
+3
Real-time financial news and economic calendar overlay for cTrader with smart alerts
"Dem" logo
Top-rated
4.2
(4)
$20
Indicator
Forex
BTCUSD
+5
Scalping indicator for Renko 100 using EMAs to show trend and entry zones with clear colored rectangles.
Indicator
MACD
Forex
+5
🚀 MACD Pro Trader – Advanced MACD with buy/sell signals, custom MAs & color-coded histograms for smarter trading! 📈🔥

Price

Since 02/01/2025