


Description
# Angora Pattern Recognition · User Guide
Angora Pattern Recognition is a cTrader indicator that finds, draws and tracks classic chart patterns automatically. For every pattern it shows a score, a state, the breakout level, a target and the invalidation level.
> This indicator is an analysis tool, not investment advice. Scores and targets come from past price geometry; they do not guarantee future prices.
## 1. Installation
1. Buy and install the indicator from the cTrader Store (or double-click the `.algo` file).
2. Open a chart and pick **AngoraPatternRecognition** from the **Indicators** menu.
3. Review the settings and press **OK**. The defaults are a good starting point for most symbols and timeframes.
## 2. How it works
**Only closed candles are used.** The candle that is still forming never reaches the engine. A pattern drawn on the chart therefore never shifts, moves or disappears by itself (no repaint). The only thing that changes is its state, for example from COMPLETED to CONFIRMED.
**A pattern is drawn once it has formed.** A swing high or low is confirmed only after **Swing Length** more candles have closed and price has pulled back at least **Swing Sensitivity** × ATR. A pattern appears when its last swing is confirmed. On a historical chart all patterns appear at once, which can look as if they were seen in advance; to watch the real-time sequence, run the indicator in cTrader's visual backtesting and step candle by candle.
**For early warnings** turn on the Forming layer (section 6). That layer does repaint and is drawn in a separate color.
**ATR-based measures.** Every tolerance is expressed in ATR (Average True Range), so the same settings behave similarly on EURUSD, gold or BTC, on M15 or daily charts.
## 3. Patterns
| Pattern | Bias | Breakout level | Invalidation | Target |
| --- | --- | --- | --- | --- |
| Double Top | Bearish | Low between the tops (neckline) | Above the higher top | Neckline − pattern height |
| Double Bottom | Bullish | High between the bottoms | Below the lower bottom | Neckline + pattern height |
| Head & Shoulders | Bearish | Neckline through the two troughs (may slope) | Above the head | Neckline − head-to-neckline distance |
| Inverse H&S | Bullish | Neckline through the two peaks | Below the head | Neckline + head-to-neckline distance |
| Ascending Triangle | Bullish | Flat upper line | Rising lower line; after the breakout, the last low | Breakout + widest part of the triangle |
| Descending Triangle | Bearish | Flat lower line | Falling upper line; after the breakout, the last high | Breakout − widest part of the triangle |
| Symmetrical Triangle | Either way | Whichever line breaks | Opposite line; after the breakout, the last swing on the other side | Breakout ± widest part of the triangle |
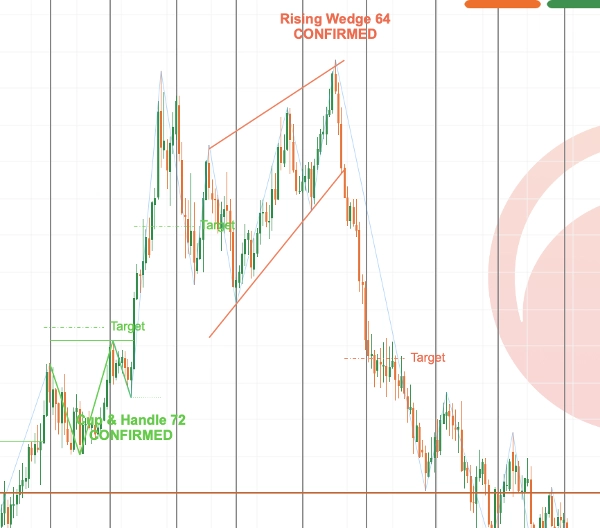
| Rising Wedge | Bearish | Rising lower line | Upper line | Breakout − widest part of the wedge |
| Falling Wedge | Bullish | Falling upper line | Lower line | Breakout + widest part of the wedge |
| Rectangle | Either way | Whichever flat line breaks | Opposite line | Breakout ± range height |
Triangles and wedges must break out within the first 75% of the way from the first touch to the apex, where the boundary lines meet (**Triangle Breakout Window**). Breakouts very close to the apex are weak, so a pattern whose last swing is already past that point is not shown, and one that does not break out in time expires.
Targets are reference levels from the classic measured-move method, not guaranteed price objectives.
## 4. States and colors
| State | Meaning | Color |
| --- | --- | --- |
| COMPLETED | Pattern formed, waiting for the breakout | Orange |
| AWAITING RETEST | Broke out, waiting for the retest (CloseAndRetest mode only) | Orange |
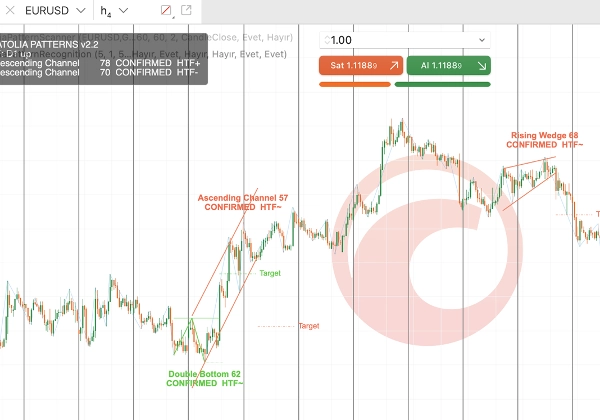
| CONFIRMED | Breakout confirmed; the target line is shown | Green when bullish, red when bearish |
| INVALIDATED | Price closed beyond the invalidation level before the breakout | Gray (if shown) |
| EXPIRED | The breakout did not come in time | Gray (if shown) |
| FAILED BREAKOUT | After confirmation, price closed back beyond the invalidation level | Gray (if shown) |
The label shows the pattern name, score and state, for example `Rising Wedge 68 CONFIRMED`.
**The score (0–100)** measures how closely the shape matches the textbook pattern: structure, geometry, symmetry, volume, trend context and breakout strength. It is not a probability of success.
## 5. Pattern panel
The panel in the top-left corner lists active patterns, best score first (up to 5). When the Forming layer is on, forming patterns are listed below under "forming". Turn it off with **Show Pattern Panel**.
## 6. Forming (early warning) layer
Off by default. With **Show Forming Patterns** on, the indicator asks on every closed candle: "In which price range would the next swing high or low have to form to complete a pattern?"
- The part of the pattern already in place is drawn dashed; the price range where the missing swing is expected is a shaded box.
- The label reads `Double Top? 72 FORMING`, or `IN ZONE` when price is already inside the box.
- **These warnings repaint:** they change as price develops and disappear when the shape breaks. Confirmed pattern drawings are not affected.
- On historical data about 15–21% of warnings turned into real patterns, and 30–34% once price had entered the box. Use them as a watch list, not as trade signals.
## 7. Alerts
| Setting | Default | Description |
| --- | --- | --- |
| Alert On New Pattern | Off | When a new pattern appears |
| Alert On Confirmation | On | When a pattern is confirmed by a breakout |
| Alert On Failure | Off | When a confirmed pattern fails |
| Popup Alert | On | Popup notification in cTrader |
| Sound Alert | On | Sound notification |
Alerts fire only on live data; loading the chart does not alert for historical patterns.
## 8. Settings
### Detection
| Setting | Default | Description |
| --- | --- | --- |
| Swing Length | 5 | Candles checked on each side of a swing high/low. Higher finds fewer, larger patterns, and swings are confirmed later. |
| Swing Sensitivity (ATR) | 1.0 | Minimum move between two swings. Higher ignores small wiggles. |
| Minimum Pattern Score | 50 | Patterns scoring lower are hidden. Around 65 gives a more selective view. |
| Maximum Pattern Age (bars) | 60 | Candles after the pattern's last swing within which the breakout must come. |
### Tolerance
| Setting | Default | Description |
| --- | --- | --- |
| Price Tolerance (ATR) | 0.75 | Allowed difference between the two tops/bottoms of a Double Top/Bottom. |
| Symmetry Tolerance (ATR) | 1.5 | Allowed difference between the two shoulders of a Head & Shoulders. |
| Trendline Deviation (ATR) | 0.5 | How far a swing may sit from a triangle/wedge/rectangle line and still count as a touch. |
| Triangle Breakout Window (%) | 75 | Share of the way to the apex within which triangles and wedges may break out. |
| Minimum Pattern Height (ATR) | 2.0 | Smaller patterns are ignored. |
| ATR Period | 14 | ATR period. |
### Confirmation
| Setting | Default | Description |
| --- | --- | --- |
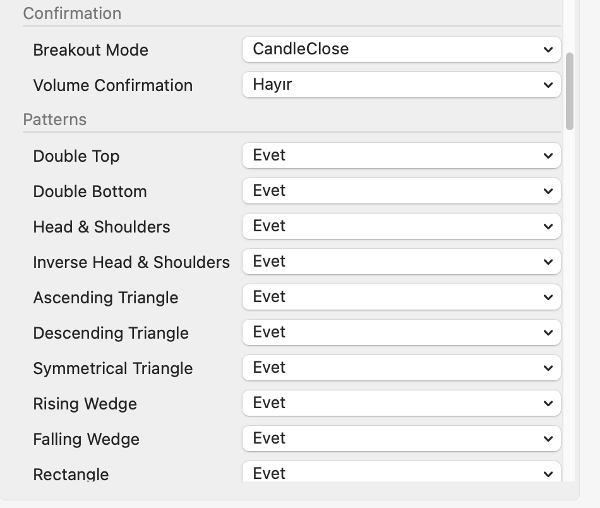
| Breakout Mode | CandleClose | **CandleClose:** one close beyond the breakout level. **TwoCandleClose:** two closes in a row. **CloseAndRetest:** one close, then price comes back to the level and holds. |
| Volume Confirmation | Off | The breakout candle's tick volume must be at least the average of the previous 20 candles. Skipped when the data has no volume. |
### Patterns
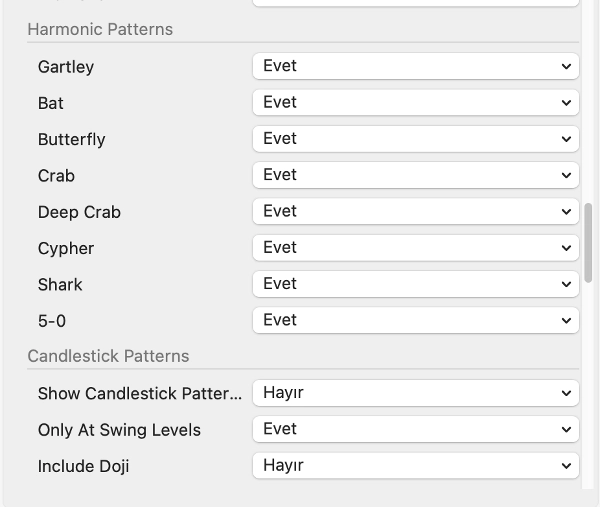
Each pattern can be switched on or off.
### Display and Colors
Labels, score, pattern lines, targets, invalidation level, failed patterns, swing lines and labels (HH/HL/LH/LL), the developing swing and the panel can each be switched on or off. Colors accept a name (`LimeGreen`) or a hex code (`#32CD32`).
## 9. FAQ
**Why does a pattern appear a few candles after its last top?** A swing is confirmed only after Swing Length more candles have closed. Lower Swing Length, or turn on the Forming layer, to see patterns earlier.
**Do patterns change when I reopen the chart?** No. The same data and settings always give the same result. Changing settings recalculates the patterns.
**I see too many patterns.** Raise Minimum Pattern Score to 60–65 and Minimum Pattern Height to 3, or switch off patterns you do not use.
**I see no patterns.** Make sure the chart has enough history (at least a few hundred candles) and lower Minimum Pattern Score.
Summary
For each detected pattern, Angora provides a score (0–100) reflecting how closely the shape matches textbook definitions, along with its current state (e.g., COMPLETED, CONFIRMED), breakout level, target price, and invalidation level. Patterns are confirmed based on swing highs and lows validated by configurable parameters such as Swing Length and Swing Sensitivity, which use ATR (Average True Range) for adaptive tolerance across different markets and timeframes.
The indicator features a pattern panel listing active patterns by score and an optional forming layer that offers early warnings of potential patterns, though these warnings may repaint. Alerts can be configured for new patterns, confirmations, and failures. Users can customize detection sensitivity, pattern types, display elements, and confirmation methods to suit their analysis needs. Angora Pattern Recognition serves as a technical analysis tool to assist traders in identifying key chart formations and potential breakout opportunities.
Customer reviews
Discussion
FAQ
More from this author



















Price