
ORB Range with FVGs
Indicador
606 transferências
Versão 1.0, Sep 2025
Windows, Mac
1.0
Avaliações: 1
Descrição
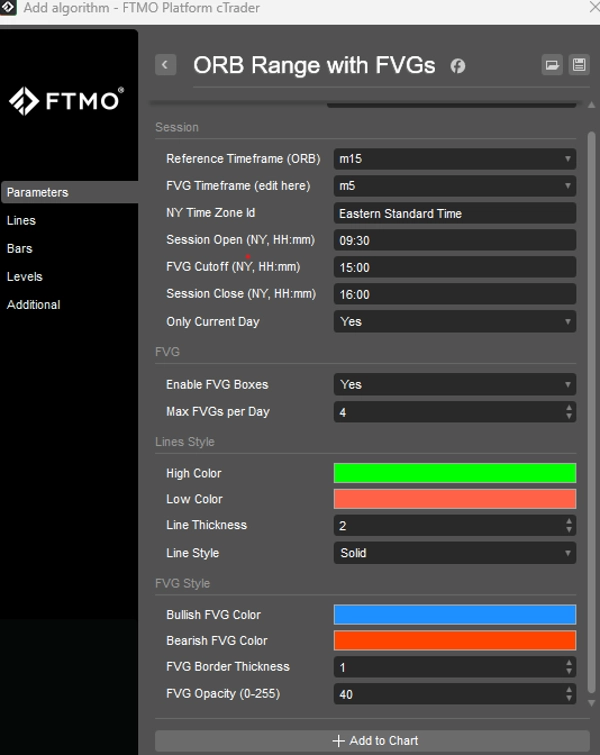
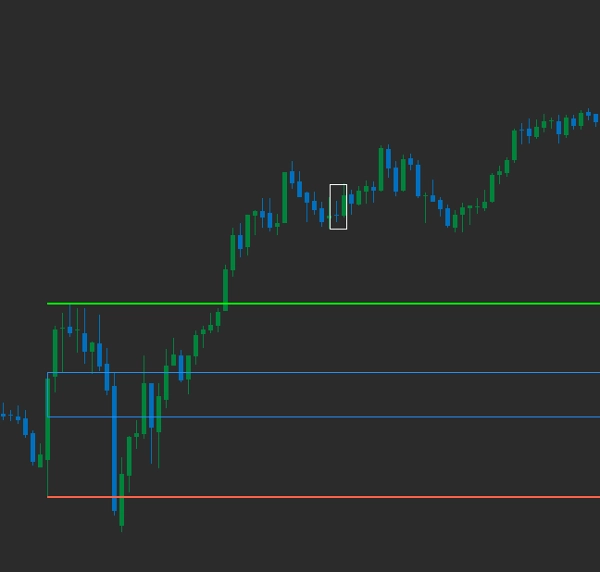
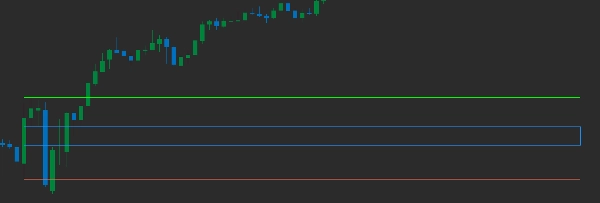
- Este indicador plota o intervalo de abertura de 15 minutos da sessão de NY com os primeiros N FVGs apresentados no gráfico após a abertura
O usuário pode:
Alterar o início e o fim do ORB para ajustar a outras sessões.
Definir o período de tempo dos FVGs que serão plotados.
Editar as cores para se adequar à sua preferência.
Note que este é apenas um indicador e não foi feito para aconselhamento financeiro de qualquer tipo.
Deixe-me saber seu feedback para melhorias futuras.
Obrigado
Resumo
Resumo de IA
The ORB Range with FVGs indicator plots the 15-minute opening range of the New York trading session on the chart, along with the first N Fair Value Gaps (FVGs) that appear after the session opens. Users can customize the indicator by adjusting the opening range start and end times to accommodate other trading sessions. Additionally, the timeframe for the FVGs displayed can be defined according to user preference. Color settings are also editable to match individual chart styles. This tool is designed to assist traders analyzing Forex, indices, and popular symbols such as EURUSD, GBPUSD, XAUUSD, NAS100, and USDJPY. It supports strategies including breakout and scalping by visually highlighting key price ranges and imbalances. The indicator serves as a visual aid and does not provide financial advice.
Perfil do indicador
Avaliações de clientes
1.0
Avaliações: 1
5 | 0 % | |
4 | 0 % | |
3 | 0 % | |
2 | 0 % | |
1 | 100 % |
Avaliações de clientes
Conversa
Perguntas frequentes
Forex
Breakout
Scalping
Indices
EURUSD
GBPUSD
Fair Value Gap
XAUUSD
NAS100
USDJPY
Os produtos disponíveis através da cTrader Store, incluindo bots de negociação, indicadores e plugins, são fornecidos por programadores terceiros e são disponibilizados apenas para fins informativos e de acesso técnico. A cTrader Store não é um corretor e não fornece aconselhamento em matéria de investimento, recomendações pessoais ou qualquer garantia de desempenho no futuro.
Mais deste autor


Preço
Desde 30/01/2025
36.05M
Volume negociado
26.73K
Pips ganhos
1.24K
Instalações gratuitas