
Descrição
O Problema: Sobrecarga de Informação
A maioria dos traders falha porque seus gráficos estão sobrecarregados com indicadores atrasados e muitas linhas. Eles perdem de vista a coisa mais importante: Estrutura de Mercado.
A Solução: Estrutura de Tendência
Este indicador é uma potência "Dois em Um" para a plataforma cTrader. Ele combina Detecção de Swing profissional com um Motor de Pontuação objetivo que lhe diz exatamente quem está no controle do mercado.
Principais Características:
- Mapeamento Inteligente da Estrutura: Identifica automaticamente níveis significativos de Suporte e Resistência usando volatilidade filtrada pelo ATR.
- O Motor de Pontuação SGE: Um sistema de classificação único (-2, 0, +2) que calcula a força da tendência com base em quantos níveis estruturais foram rompidos.
- Tecnologia Anti-Confusão: Exibe apenas os 3 níveis relevantes mais próximos do preço atual. Seu gráfico permanece limpo, profissional e acionável.
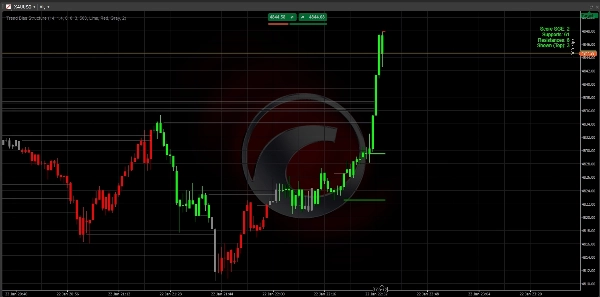
- Detecção de Momentum: Usa a lógica de "Grande Vela" para garantir que você negocie apenas movimentos com suporte institucional real.
- Totalmente Personalizável: Ajuste a sensibilidade para seu ativo específico (XAUUSD, Forex ou Índices).
Como Negociar com Ele:
- Verifique a Pontuação: Procure por +2 (Altista) ou -2 (Baixista).
- Espere o Retorno: Deixe o preço retornar para uma das Linhas de Estrutura desenhadas.
- Execute: Negocie com a tendência, usando os níveis como seus pontos de entrada/saída.
Especificações Técnicas
- Plataforma: cTrader
- Linguagem: C# (.NET)
- Intervalos de Tempo: Funciona em todos os intervalos (M1 a Mensal).
- Ativos: Otimizado para pares de alta liquidez (XAUUSD, EURUSD, GBPUSD).
Nota: Configurações Iniciais: Para a maioria dos pares principais, as configurações padrão estão otimizadas. Se você estiver negociando índices voláteis, pode querer aumentar o Range Global ATR Mult para 2.0
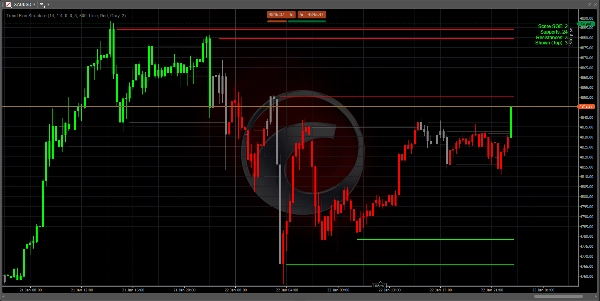
Importante: Como Ler o Painel
O painel no canto superior direito é seu centro de comando:
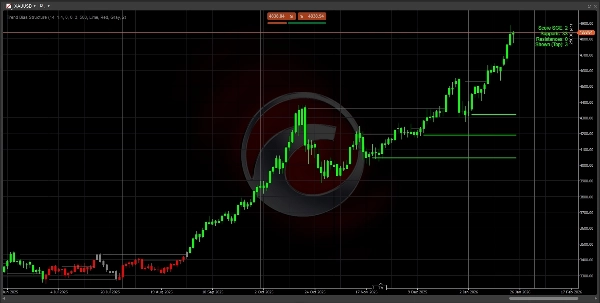
- Pontuação +2 (Verde): Forte alta. Procure apenas por setups de Compra.
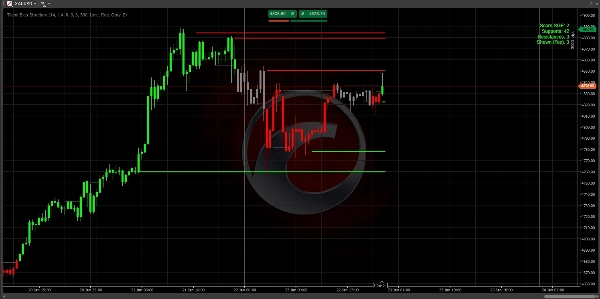
- Pontuação -2 (Vermelho): Forte baixa. Procure apenas por setups de Venda.
- Pontuação 0 (Cinza): Neutro. O mercado está em consolidação ou transição. Mantenha a paciência.
- Suportes/Resistências: Mostra quantos "pavimentos" e "tetos" históricos existem na tendência atual.
Estratégia de Entrada em 3 Passos
Passo 1: Identifique a Tendência Espere as cores das velas e a pontuação do Painel atingirem +2 ou -2. Isso confirma que o mercado quebrou a estrutura e uma tendência está começando.
Passo 2: A Área de Valor Não corra atrás do preço. Espere o preço recuar (retracement) em direção a uma das 3 linhas mais próximas desenhadas no seu gráfico.
- Em uma tendência de baixa (Pontuação -2), espere o preço tocar uma Linha Vermelha.
- Em uma tendência de alta (Pontuação +2), espere o preço tocar uma Linha Verde.
Passo 3: Execução Entre na negociação quando o preço tocar a linha e mostrar uma rejeição (formação de pavio).
- Stop Loss: Coloque seu SL logo atrás da linha estrutural.
- Take Profit: Mire na próxima linha estrutural na direção da tendência.
Dicas Profissionais para o Sucesso
- Regra dos Intervalos Maiores: Uma pontuação de +2 no H4 ou D1 é muito mais poderosa do que uma pontuação no gráfico M5. Use o intervalo maior para encontrar a tendência e o menor para encontrar sua entrada.
- Gráficos Limpos: Se a tela parecer cheia, vá para as configurações e altere
Max Levels to Showpara 2. Isso mostrará apenas o "Pavimento" e "Teto" mais críticos. - A Zona "Zero": Quando a pontuação é 0, o mercado está "recalculando". Este é o melhor momento para realizar lucros de negociações anteriores e esperar por um novo rompimento.
Resolução de Problemas
- Nenhuma Linha Visível? Verifique se você tem histórico suficiente carregado no seu gráfico. O indicador precisa de pelo menos 100-200 barras para calcular o ATR e os níveis de Swing.
- Indicador Lento? Se seu PC estiver lento, reduza a configuração
Max Historical Linespara 200 para liberar memória mais rapidamente.
Perguntas Frequentes (FAQ)
P: Este indicador redesenha?
R: Não. Os níveis e pontuações são calculados com base em fechamentos confirmados de velas. Uma vez que um nível é rompido ou uma pontuação muda no fechamento da vela, isso fica registrado no histórico.
P: Qual o melhor intervalo de tempo?
R: A lógica é universal. No entanto, a maioria dos traders profissionais usa em gráficos H1, H4 ou Diário para identificar a "Estrutura Institucional". Se você fizer scalping em M1 ou M5, espere mudanças de pontuação mais frequentes.
P: Posso usar este indicador com outros?
R: Sim! Ele funciona perfeitamente como um "Filtro Direcional". Por exemplo, só faça sinais de sobrevenda do RSI se a Pontuação de Tendência for +2.
Boas Negociações!
Sem Conselho Financeiro. O indicador Trend Bias Structure é uma ferramenta de análise técnica projetada para ajudar traders a identificar a estrutura do mercado e a tendência.
Resumo
Key features include:
- Smart Structure Mapping: Automatically detects significant support and resistance levels filtered by ATR-based volatility.
- SGE Scoring Engine: Calculates trend strength by counting breached structural levels.
- Anti-Clutter Display: Shows only the three closest relevant levels to maintain chart clarity.
- Momentum Detection: Uses "Big Candle" logic to highlight moves with institutional backing.
- Customizable sensitivity for different assets such as XAUUSD, EURUSD, GBPUSD, and indices.
The indicator works on all timeframes from 1 minute to monthly, with professional traders typically using H1, H4, or daily charts to identify institutional structure. The dashboard provides a clear bias score and structural levels to guide trade entries and exits. Users are advised to trade with the bias, waiting for price pullbacks to the nearest structure lines before executing trades.
This tool is intended as a directional filter and can be combined with other indicators like RSI. It does not repaint, as calculations are based on confirmed candle closes.
Avaliações de clientes
5 | 100 % | |
4 | 0 % | |
3 | 0 % | |
2 | 0 % | |
1 | 0 % |


