Descrição
A maioria dos traders depende de indicadores defasados que reagem ao preço depois que o movimento aconteceu. O FFT-SDE Visual Engine adota uma abordagem quantitativa fundamentalmente diferente. Não é apenas um oscilador; é um conjunto de processamento de sinais em tempo real e previsão integrado diretamente no cTrader.
Ele opera com base em dois princípios fundamentais:
- O Mercado tem Ritmos (Ciclos): Usando a análise de Transformada Rápida de Fourier (FFT), o indicador decompõe a ação do preço em seus componentes de frequência principais, filtrando o ruído para revelar o ciclo dominante e negociável. Isso indica quando o mercado provavelmente vai virar.
- O Movimento do Preço tem uma Natureza Estatística (SDE): Ao modelar o preço como uma Equação Diferencial Estocástica (processo Ornstein-Uhlenbeck), ele quantifica a deriva (momentum), volatilidade (risco) e velocidade de reversão à média do mercado. Isso indica como o mercado provavelmente se moverá e a probabilidade de uma negociação bem-sucedida.
Ao fundir esses dois mundos—Análise de Ciclos (FFT) e Previsão Estocástica (SDE)—o Motor FFT-SDE oferece uma visão holística do mercado que simplesmente não está disponível em ferramentas padrão.
2. Utilidade Principal: Que Problemas Ele Resolve?
Veja como um trader pode usar este indicador para melhorar sua tomada de decisão:
- Problema 1: "Não consigo saber se o mercado está em tendência ou apenas lateralizando."
-
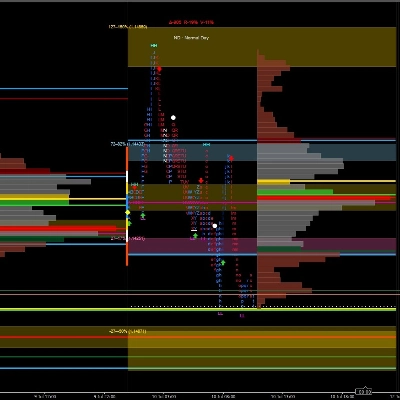
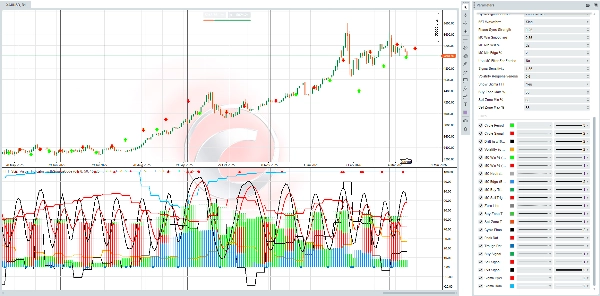
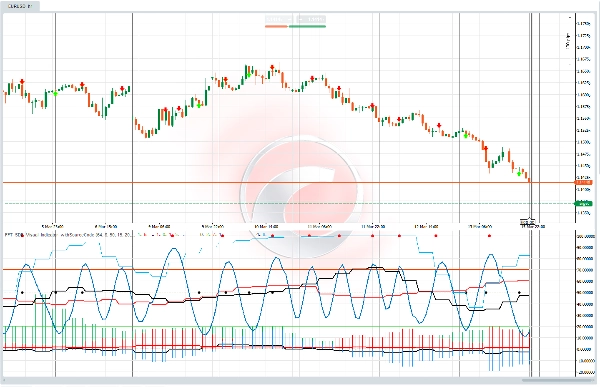
- Solução (Período do Ciclo & Ciclicidade Sigma): O Histograma do Período do Ciclo mostra instantaneamente a duração do ciclo dominante atual do mercado. Quando o ciclo está claro e forte, você pode negociar as oscilações. Quando a Ciclicidade Sigma % (ciclo de volatilidade) está alta, você sabe que deve esperar períodos de expansão e contração do risco, permitindo ajustar dinamicamente o tamanho da sua posição.
- Problema 2: "Minhas entradas são sempre muito cedo ou muito tarde."
-
- Solução (Fase do Ciclo & Zonas de Entrada): O indicador mapeia o ciclo do mercado em uma onda suave de 0-100% — a Fase do Ciclo % . Em vez de adivinhar topos e fundos, você pode esperar o preço entrar em zonas pré-definidas de Compra (0-35%) e Venda (60-88%). Esses não são níveis arbitrários; são derivados dinamicamente da frequência dominante do mercado, dando a você uma vantagem significativa no timing.
- Problema 3: "Não sei se uma configuração tem alta probabilidade de sucesso."
-
- Solução (Simulação de Monte Carlo): Esta é a funcionalidade matadora. Para cada barra, o motor executa centenas de caminhos de preço simulados (Monte Carlo) baseados na dinâmica atual do mercado. Ele então exibe o MC Win % (Compra) e MC Win % (Venda) . Isso não é um sentimento ou uma intuição; é uma probabilidade estatística de uma negociação com risco-recompensa 1:2,5 funcionar antes mesmo de você entrar nela. Você pode literalmente ver se as chances estão a seu favor.
- Problema 4: "Indicadores padrão são muito lentos e ruidosos."
-
- Solução (Adaptativo & Multifacetado): Este indicador não é estático. Seu modelo de Volatilidade Adaptativa responde em tempo real a choques de preço e impulsos do ciclo. O Sigma FFT indica se a própria volatilidade está se tornando cíclica, alertando sobre períodos iminentes de calma ou explosão. Cada componente é projetado para se adaptar às condições atuais do mercado.
Você não encontrará outro indicador no marketplace do cTrader que combine essas características em um sistema único, coerente e visual.
- A Camada "Sigma FFT": Uma coisa é saber que o preço tem um ciclo. É um nível totalmente novo de sofisticação saber que a própria volatilidade tem um ciclo. Isso proporciona uma enorme vantagem na antecipação de mudanças na estrutura do mercado.
- Vantagem Probabilística, Não Certeza: As saídas de Monte Carlo afastam o trader da busca pela "certeza do santo graal" e o direcionam para uma mentalidade profissional de gerenciamento de probabilidades e vantagens.
- Totalmente Visual & Personalizável: Toda essa matemática complexa é apresentada em um formato limpo, com múltiplos painéis e ampla personalização (mais de 27 parâmetros). Você pode adaptá-lo ao seu estilo de negociação específico, desde scalping até swing trading.
- Fusão Coerente: A fase do ciclo que gera seus sinais de compra/venda é o mesmo ciclo usado para calcular a deriva e a volatilidade adaptativa. Cada parte do indicador se comunica com as outras, criando um modelo de mercado unificado e consistente.
Este indicador é perfeito para o trader que:
- Está cansado de indicadores defasados e quer uma abordagem mais preditiva e científica.
- Tem algum entendimento sobre ciclos, volatilidade e o valor da probabilidade estatística.
- Quer construir um sistema de negociação robusto baseado em regras.
- Negocia instrumentos com comportamento cíclico (por exemplo, pares Forex, Índices, Commodities como Ouro).
- Está disposto a investir em uma ferramenta profissional para obter uma vantagem genuína nos mercados.
O FFT-SDE Visual Engine transforma conceitos complexos de finanças quantitativas em uma ferramenta prática e acionável para negociação. Ele o leva de adivinhar para saber, de reagir para antecipar. Se você está pronto para negociar com uma compreensão mais profunda da estrutura do mercado e uma vantagem probabilística quantificável, este é o motor que você estava esperando.
Resumo
Avaliações de clientes
5 | 67 % | |
4 | 33 % | |
3 | 0 % | |
2 | 0 % | |
1 | 0 % |