
Descrição
RiskLotSizer é um indicador de dimensionamento de posição e gerenciamento de risco baseado em gráfico para cTrader, projetado para ajudar os traders a calcular rapidamente e visualmente o tamanho apropriado da negociação.
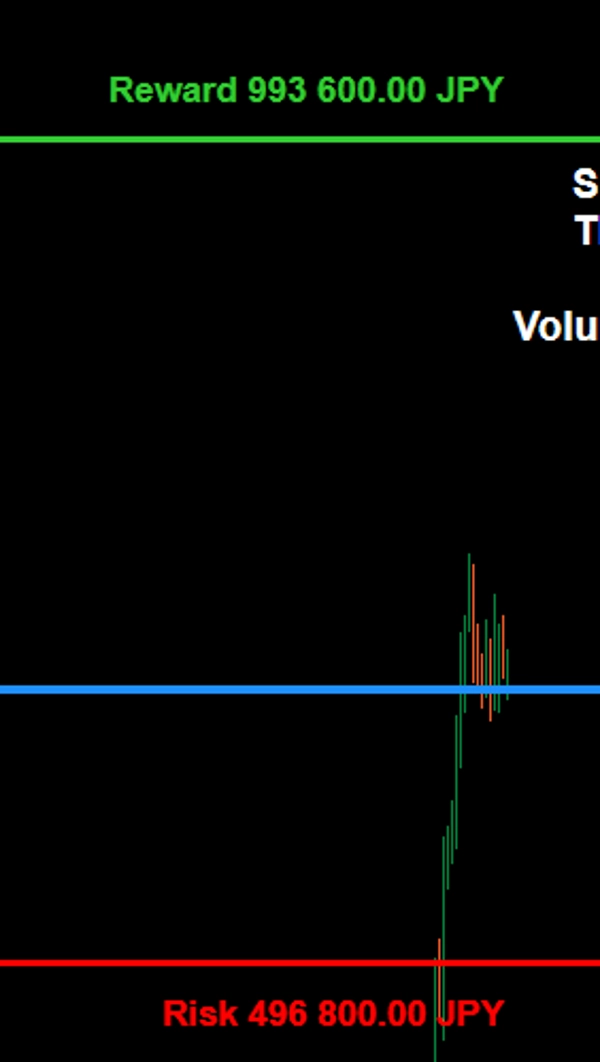
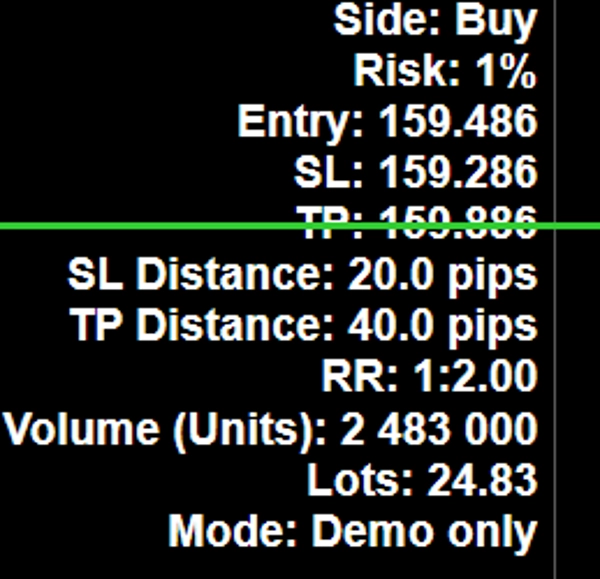
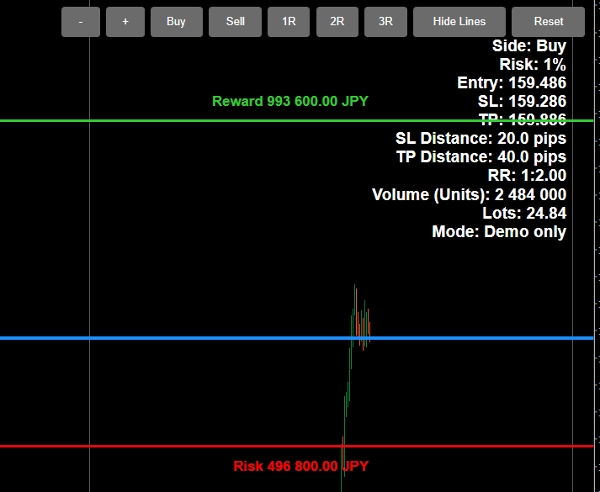
O indicador permite ajustar os níveis de Entrada, Stop Loss e Take Profit diretamente no gráfico, facilitando o planejamento das negociações em tempo real. Com base na porcentagem de risco selecionada do patrimônio da conta, o RiskLotSizer calcula automaticamente o tamanho da posição e exibe o tamanho estimado do lote, o valor do risco, o valor da recompensa e a relação risco/recompensa.
Ele suporta cenários de Compra e Venda e foi projetado para oferecer aos traders uma visão visual clara do risco da negociação antes de entrar em uma posição. Os valores de risco e recompensa são mostrados diretamente próximos às linhas SL e TP, enquanto o painel principal de informações fornece um resumo limpo da configuração.
As principais características incluem:
- Cálculo do tamanho do lote baseado em uma porcentagem escolhida do patrimônio
- Linhas ajustáveis de Entrada, SL e TP diretamente no gráfico
- Exibição em tempo real do tamanho da posição, valor do risco, valor da recompensa e RR
- Suporte para modos de Compra e Venda
- Botões rápidos de pré-configuração de RR para planejamento de negociações mais rápido
- Suporte aos idiomas inglês e japonês
- Alternância de visibilidade das linhas para um gráfico mais limpo quando necessário
RiskLotSizer é ideal para traders discricionários, traders diários e qualquer pessoa que queira uma maneira mais rápida e clara de dimensionar posições enquanto mantém um controle consistente de risco.
RiskLotSizer は、チャート上で直感的にポジションサイズを計算できる cTrader 用のポジションサイジング・リスク管理インジケーターです。
Entry、Stop Loss、Take Profit の各ラインをチャート上で直接動かしながら、指定した有効証拠金比率に基づく適正ロット数を自動計算します。これにより、トレード前に必要なロット数、想定損失額、想定利益額、Risk/Reward をリアルタイムで把握できます。
Buy / Sell の両方に対応しており、RR プリセットボタンによって利確目標の調整も素早く行えます。また、SL・TP 付近には損失額・利益額が表示されるため、視覚的にも分かりやすく、実践的なトレード設計をサポートします。
主な特長:
- 有効証拠金に対する指定リスク率からロット数を自動計算
- Entry / SL / TP をチャート上で直接調整可能
- ロット数、損失額、利益額、RR をリアルタイム表示
- Buy / Sell の両方に対応
- RR プリセットボタン搭載
- 英語 / 日本語切替対応
- 必要に応じてライン表示の ON / OFF が可能
RiskLotSizer は、裁量トレーダー、デイトレーダー、そして一貫したリスク管理を重視するトレーダーに適したインジケーターです。
Resumo
Avaliações de clientes
5 | 0 % | |
4 | 100 % | |
3 | 0 % | |
2 | 0 % | |
1 | 0 % |