
Dominator M4tr1x
Esta é uma ferramenta informativa básica que combina análise da estrutura de preço do smart-money no gráfico com múltiplos painéis de painel de informações. Aqui está uma descrição de cada sistema principal:
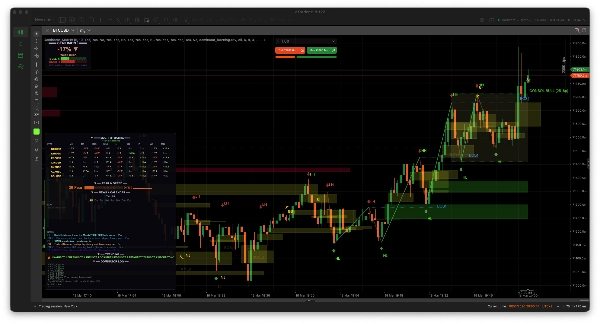
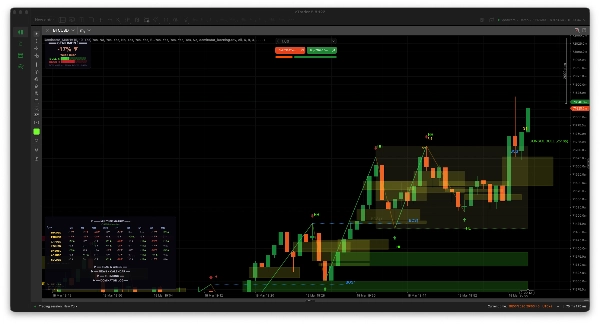
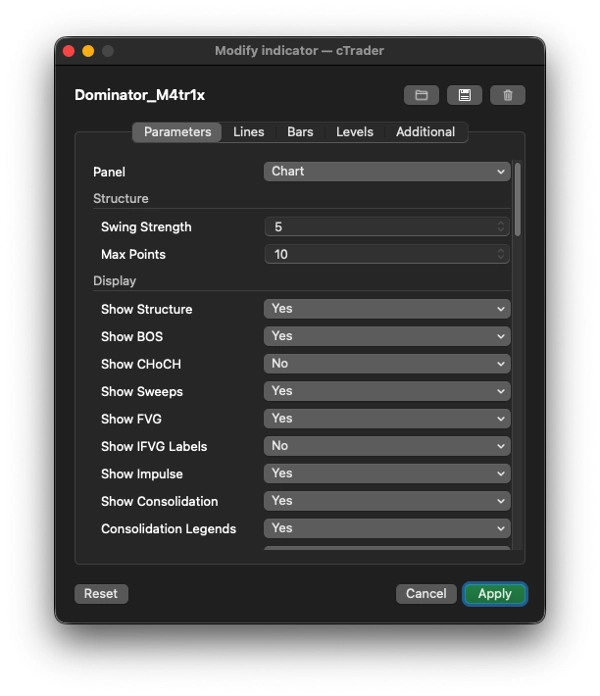
1. 📊 NO GRÁFICO: Análise da Estrutura do Smart Money
Desenha diretamente no gráfico de preços:
Recurso
O que faz ;
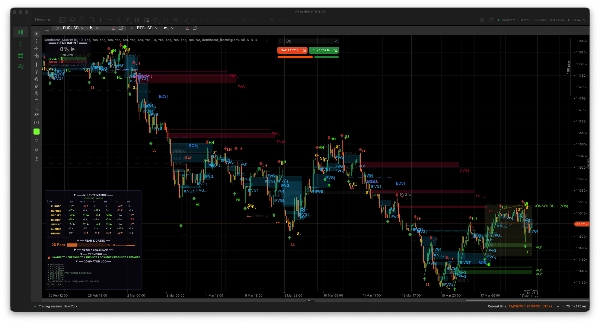
Detecção de Oscilação
Identifica máximas/mínimas de oscilação usando uma força de retrocesso configurável, marcando-as com setas (▲/▼)
Rótulos de Estrutura
Rotula cada oscilação como HH (Higher High), HL (Higher Low), LH (Lower High), LL (Lower Low) para mapear a estrutura do mercado
BOS (Break of Structure)
Desenha linhas pontilhadas + rótulos quando o preço rompe uma máxima/mínima de oscilação anterior na direção da tendência
CHoCH (Change of Character)
Igual ao BOS mas contra a tendência — sinaliza uma possível reversão de tendência
Invalidação de Rompimento
Se o preço reverte de volta através de um nível BOS/CHoCH, marca como falhou (esmaecido com ✗) e registra
Varreduras de Liquidez
Detecta quando o preço faz um pavio acima de uma máxima de oscilação (ou abaixo de uma mínima de oscilação) mas fecha de volta dentro — um padrão clássico de captura de liquidez
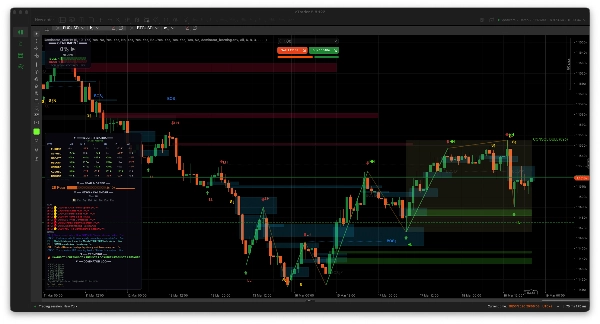
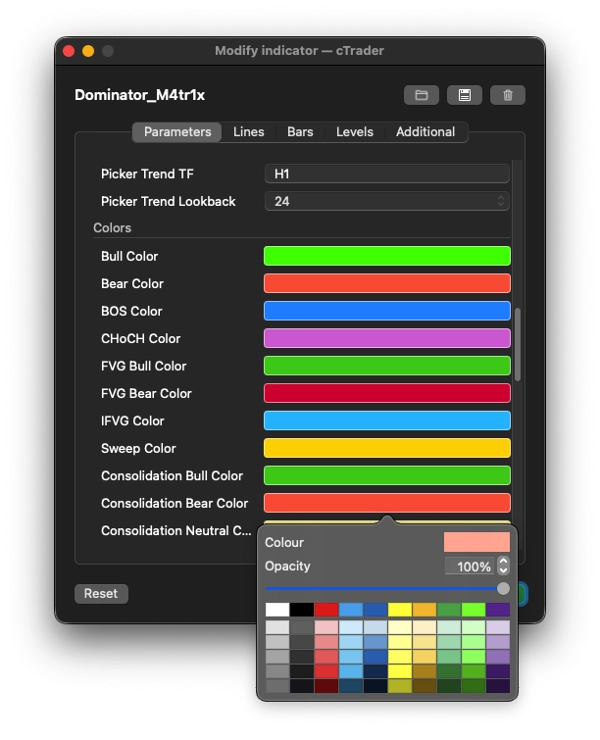
FVG (Fair Value Gaps)
Detecta desequilíbrios de 3 velas (lacunas entre a máxima da vela 1 e a mínima da vela 3). Desenha retângulos coloridos no gráfico
IFVG (FVG Invertido)
Quando o preço retorna para preencher um FVG, rotula como "IFVG" (a lacuna torna-se uma zona potencial de suporte/resistência)
Invalidação de FVG
Se o preço fecha decisivamente através de uma zona FVG, é marcado como invalidado
Ondas de Impulso
Conecta pontos de oscilação com linhas de tendência — verde para pernas de impulso (com a tendência), amarelo para pernas corretivas
Zonas de Consolidação
Detecta quando máximas e mínimas consecutivas estão dentro de uma faixa estreita baseada em ATR, desenha uma caixa com um rótulo "CONSOL BULL/BEAR/NEUTRAL" mostrando viés de direção e largura em pips
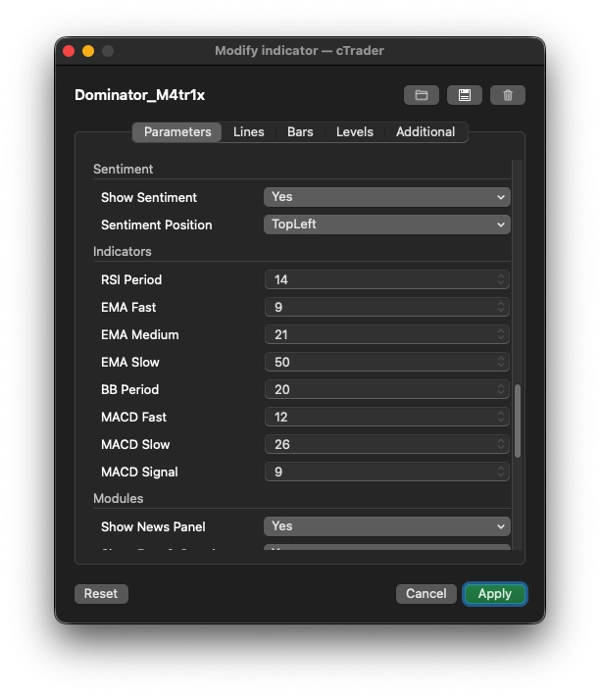
2. 📈 PAINEL DE SENTIMENTO (canto superior esquerdo por padrão)
Um medidor de pontuação bull/bear em tempo real para o símbolo/intervalo de tempo atual do gráfico usando:
- RSI (detecção de sobrecompra/sobrevenda + divergência)
- MACD (cruzamentos, momento do histograma)
- 3 EMAs (alinhamento rápido/médio/lento e posição do preço em relação a elas)
- Bandas de Bollinger (preço nos extremos da banda superior/inferior)
Exibe:
- Uma pontuação percentual de -100% a +100% (ex., "+67% BULL FORTE")
- Barras visuais bull vs. bear (█████░░░░)
- Estatísticas de sinais em execução (total de sinais, confirmados, invalidados, % de precisão)
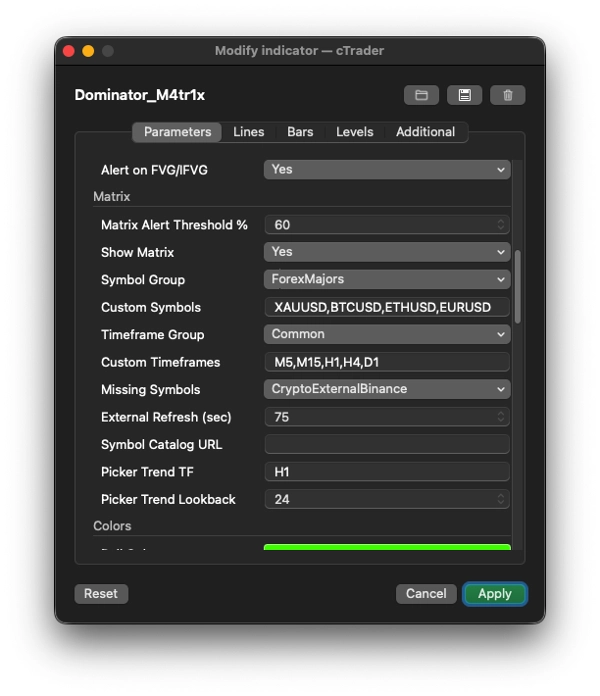
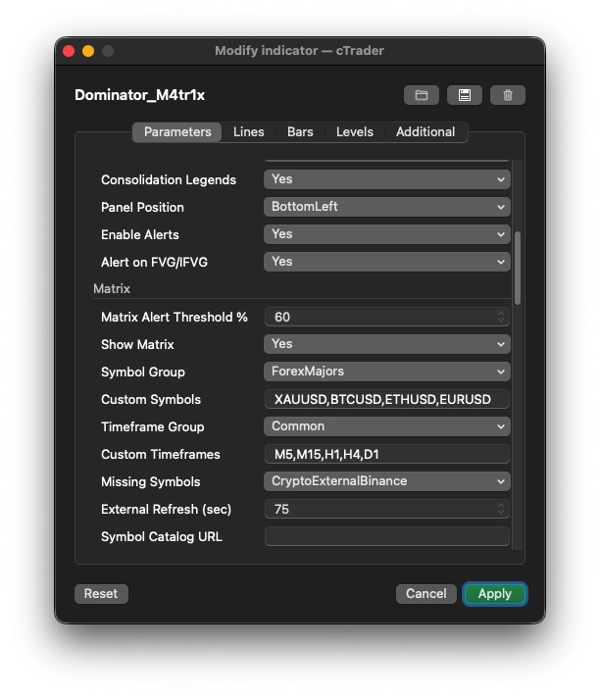
3. 🔢 MATRIZ MULTI-TIMEFRAME (painel principal)
Uma grade/mapa de calor mostrando pontuações de sentimento bull/bear através de múltiplos símbolos × múltiplos intervalos de tempo simultaneamente.
Aspecto
Detalhes
Grupos de símbolos
Forex Majors/Minors/Exóticos, Cripto, Índices, Ações dos EUA, Metais, Energia, Commodities, ou Personalizado
Grupos de intervalos de tempo
Comum (M5–W1), Todos, ou Personalizado
Cada célula
Mostra uma pontuação codificada por cores como "+42▲" (verde) ou "-67▼" (vermelho) usando o mesmo motor de pontuação RSI/MACD/EMA/BB
Resolução de símbolo
Extremamente robusta — detecta automaticamente convenções de nomenclatura do corretor (sufixos como .r, m, .cash, barras como EUR/USD), tenta dezenas de permutações de alias, armazena resultados em cache
Dados externos
Para símbolos que o corretor não oferece (especialmente cripto), busca dados OHLC de Binance, Bybit, OKX, Kraken, Bitfinex APIs (gratuitas, sem necessidade de chave)
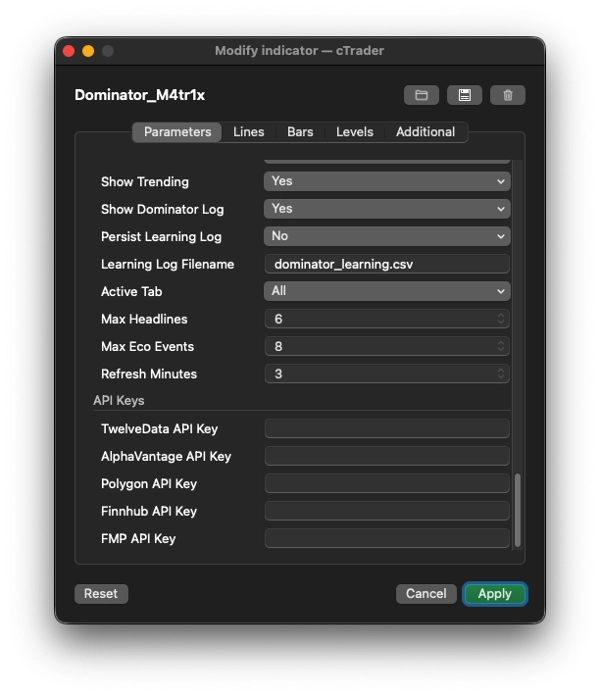
APIs Premium
Opcionalmente suporta TwelveData, AlphaVantage, Polygon, Stooq para ações/índices/forex via chaves API
Interativo
Clique em qualquer nome de símbolo → abre um seletor de símbolo pesquisável com mais de 100 símbolos em todas as categorias, mostrando variação % em 24h. Clique em qualquer cabeçalho de intervalo de tempo → abre um seletor de intervalo de tempo para trocar colunas
Alertas
Quando qualquer célula ultrapassa um limite configurável (ex., ±60%), toca um som de alerta
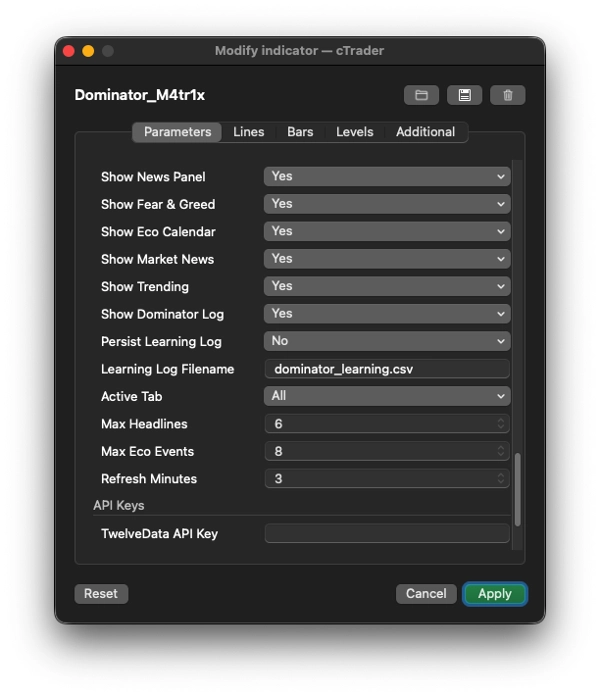
4. 📰 PAINÉIS DE NOTÍCIAS + INFORMAÇÕES
Calendário Econômico
Agrega eventos econômicos futuros de alto/médio impacto de 8+ fontes redundantes:
- ForexFactory (JSON + XML), TradingView, Finnhub, TradingEconomics, MQL5, FXStreet, FMP (FinancialModelingPrep)
- Codificado por cores por urgência (vermelho = AGORA, laranja = <15 min, amarelo = <1 hora, verde = depois)
Manchetes de Notícias do Mercado
Agrega de 12+ fontes RSS/API:
- Cripto: CryptoCompare, CoinDesk, CoinTelegraph, NewsBTC, anúncios Binance, status do sistema OKX
- Forex: FXStreet, ForexLive
- Índices/Ações: MarketWatch, CNBC, Reuters, Yahoo Finance
- Auto-categorização de manchetes (cripto/forex/metais/energia/ações) por detecção de palavras-chave
- Filtrável por aba (Todas, Forex, Cripto, Metais, Índices, Ações, Energia, Econômico)
Índice de Medo & Ganância
- Busca o Índice de Medo & Ganância Cripto (API alternative.me, com fallback CNN Business)
- Mostra valor numérico (0–100), rótulo (Medo Extremo → Ganância Extrema), barra colorida, e histórico sparkline de 7 dias (▁▂▃▄▅▆▇█)
Tendências
- Busca principais movimentadores cripto do ticker de 24h da Binance (top 5 ganhadores + top 5 perdedores)
- Recai para CoinGecko trending ou CoinPaprika
5. 📝 LOG DO DOMINATOR + SISTEMA DE APRENDIZADO
- Mantém um registro de sinais mostrando os últimos 8 sinais com status (● ativo, ✓ confirmado, ✗ invalidado)
- Rastreia estatísticas gerais de precisão (total de sinais, confirmações, invalidações, % de precisão)
- Persistência CSV opcional: grava cada evento de sinal (novo/confirmar/invalido) em um arquivo CSV (
dominator_learning.csv) com metadados completos — projetado para alimentar aprendizado de máquina futuro ou backtesting
6. 🛠 Destaques da Arquitetura Técnica
- Sobreposição completa (
IsOverlay = true) — desenha no gráfico de preços, não em um painel separado - AccessRights = None — roda no sandbox do corretor (sem acesso ao sistema de arquivos / rede além do que o cAlgo permite)
- Busca de dados assíncrona — todas as chamadas HTTP rodam em threads de fundo via
Task.Run()para nunca bloquear o gráfico - Cache inteligente — resolução de símbolo, dados OHLC externos, preços de ticker e percentuais de tendência são todos armazenados em cache com intervalos de atualização configuráveis
- Repetição automática — resoluções de símbolo falhadas e buscas de dados externos tentam novamente a cada 45 segundos
- Seções recolhíveis — cada seção do painel (Matriz, Medo & Ganância, Notícias, Tendências, Log) pode ser recolhida/expandida clicando no cabeçalho
Em resumo
Dominator M4tr1x é um indicador informativo que substitui um painel de negociação completo. Ele mapeia a estrutura do smart-money no gráfico (BOS, CHoCH, FVGs, varreduras, consolidação), pontua o sentimento multi-ativo/multi-intervalo via indicadores técnicos, agrega calendários econômicos e notícias do mercado de mais de 20 fontes, rastreia Medo & Ganância, mostra ativos em tendência, registra todos os seus próprios sinais com rastreamento de precisão, e permite trocar símbolos e intervalos de tempo interativamente — tudo enquanto busca dados faltantes de mais de 5 APIs externas de exchanges em segundo plano.
5 | 0 % | |
4 | 100 % | |
3 | 0 % | |
2 | 0 % | |
1 | 0 % |


