
3 Bar Triangle by Linda Raschke
Indicador
535 transferências
Versão 1.0, Sep 2024
Windows, Mac
5.0
Avaliações: 1
Descrição
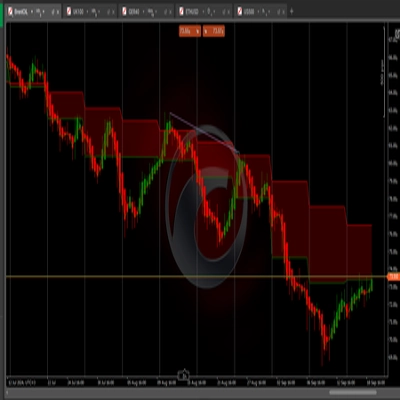
Esse padrão sugere consolidação ou compressão de preço, onde o preço está se contraindo dentro de uma faixa mais estreita. O mercado está "se enrolando" para um possível rompimento em qualquer direção, tipicamente levando a um movimento acentuado assim que rompe o triângulo.
Negociando o Rompimento:
- Entrada: Os traders procuram um rompimento acima da máxima do padrão ou abaixo da mínima do padrão, indicando a direção do próximo movimento.
- Stop-loss: Colocar um stop-loss do lado oposto do triângulo (ou acima da máxima ou abaixo da mínima) ajuda a gerenciar o risco.
- Alvos: Alguns traders visam um movimento de preço igual ao tamanho do triângulo (a distância entre a máxima e a mínima da primeira barra)
Resumo
Perfil do indicador
Avaliações de clientes
5.0
Avaliações: 1
5 | 100 % | |
4 | 0 % | |
3 | 0 % | |
2 | 0 % | |
1 | 0 % |
Avaliações de clientes
August 12, 2025
Pros: Identifies classic 3-bar triangle consolidation zones. Simple setup, visually clear. Stable across timeframes. Cons: No alerts or tooltips. Lacks volume filters and signal confirmation. Limited customization
Conversa
Perguntas frequentes
Breakout
Os produtos disponíveis através da cTrader Store, incluindo bots de negociação, indicadores e plugins, são fornecidos por programadores terceiros e são disponibilizados apenas para fins informativos e de acesso técnico. A cTrader Store não é um corretor e não fornece aconselhamento em matéria de investimento, recomendações pessoais ou qualquer garantia de desempenho no futuro.
Mais deste autor


Preço
Desde 19/09/2024
314.61K
Volume negociado
258.47K
Pips ganhos
535
Instalações gratuitas