
Descrição
📈 Indicador Divergency v1.1 para cTrader: Um Guia Abrangente 🚀
O indicador Divergency v1.1 é uma ferramenta poderosa projetada para a plataforma cTrader para identificar divergências e correlações entre a ação do preço e vários osciladores. Este guia fornece uma descrição detalhada do código, sua funcionalidade e instruções passo a passo sobre como usá-lo efetivamente. Seja você um iniciante ou um trader experiente, este indicador pode aprimorar sua análise técnica com configurações personalizáveis e sinais visuais. Vamos começar! 🌟
🎯 Visão Geral do Indicador Divergency11
O indicador Divergency v1.1 analisa os movimentos de preço e o comportamento do oscilador para detectar:
- Divergências Regulares: Sinaliza potenciais reversões quando o preço e o indicador se movem em direções opostas.
- Divergências Ocultas: Indica continuação de tendência quando o preço e o indicador se alinham de forma diferente.
- Correlações: Destaca quando o preço e o indicador se movem sincronizados, sugerindo força da tendência.
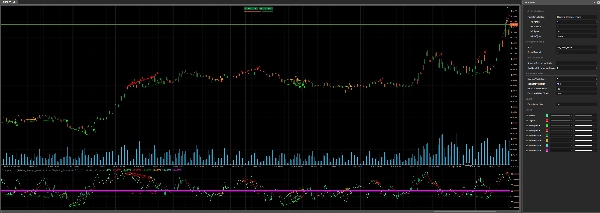
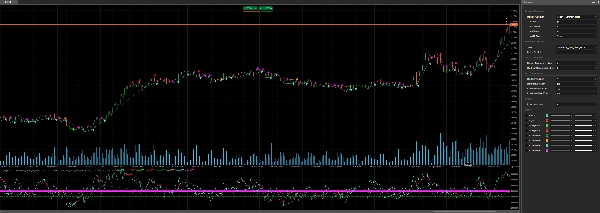
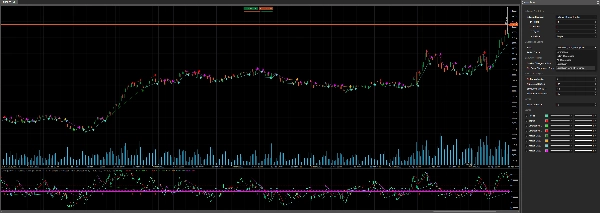
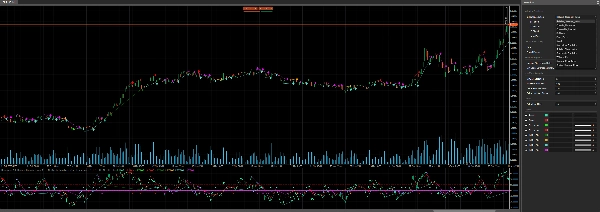
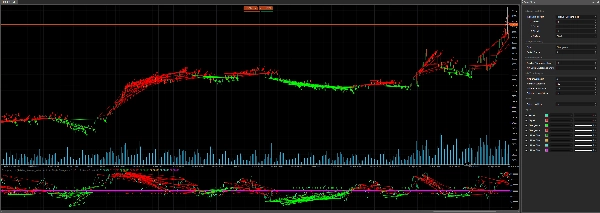
Suporta 12 osciladores diferentes (ex.: RSI, MACD, Estocástico) e permite personalização dos parâmetros de detecção de divergência, tornando-o versátil para várias estratégias de negociação. O indicador plota sinais diretamente no gráfico e na área do indicador, usando linhas coloridas, ícones e texto para visualização clara. 📊
🔍 Análise do Código
1. Configuração do Indicador 🛠️
- Namespace e Classe: Definidos no namespace
cAlgocomoDivergency v1.1, herdando deIndicator. - Atributos:
-
IsOverlay = false: Exibe em uma janela de indicador separada.TimeZone = TimeZones.UTC: Usa UTC para consistência.AccessRights = AccessRights.None: Nenhuma permissão especial necessária.
2. Parâmetros ⚙️
O indicador oferece ampla personalização através de parâmetros, agrupados para clareza:
- Seleção do Oscilador:
-
IndicatorSelection: Escolha entre 12 osciladores (ex.: RSI, MACD, Estocástico). (Normalizado para 50 como meio, e resultado maior para processo de otimização)Value1,Value2,Value3: Ajustam período, suavização e configurações da linha de sinal.MaType: Seleciona o tipo de média móvel (ex.: Simples, Exponencial).
- Configurações de Divergência:
-
Strat: Escolha o modo de detecção (Divergência, Divergência Oculta, Correlação ou combinações).PeriodFractal: Define o período fractal para identificar picos/vales (deve ser ímpar).LookBack: Número de divergências históricas para analisar.MinCountDivergenceShow: Divergências mínimas necessárias para exibir sinais.
- Análise de Zona:
-
MinBarsValidation,MaxBarsValidation: Define o intervalo válido de barras para detecção de divergência.ExtraLevelMin,ExtraLevelMax: Define os limites de sobrecompra/sobrevenda do oscilador.
- Níveis:
-
ExtraLevelLine: Ajusta as linhas de sobrevenda/sobrecompra em torno do nível 50.
3. Saídas 📈
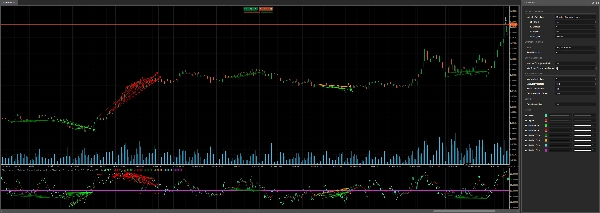
Result: Valor principal do oscilador (linha verde).Signal: Linha de sinal suavizada (linha vermelha).- Sinais de divergência (plotados como pontos):
-
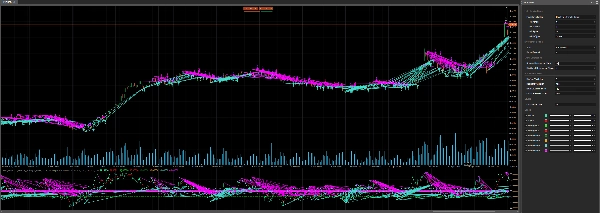
ResDivergenceUp(Lima),ResDivergenceDown(Vermelho): Divergências regulares.ResDivergenceUpHidden(Verde),ResDivergenceDownHidden(Laranja): Divergências ocultas.ResCorrelationUp(Turquesa),ResCorrelationDown(Magenta): Correlações.
4. Funções Principais 🧠
- Initialize(): Configura o indicador, valida parâmetros e desenha linhas estáticas (sobrevendido, sobrecomprado, zero).
- Calculate(): Calcula valores do oscilador, normaliza em torno de 50 e detecta fractais para análise de divergência.
- GetFractal(): Identifica picos (fractalUp) e vales (fractalDown) no oscilador.
- GetDivergence(): Analisa pontos fractais para detectar divergências ou correlações.
- CreateLine(): Desenha linhas de tendência e ícones para sinais detectados.
- DawDivergence(): Visualiza divergências com linhas e setas no gráfico e na área do indicador.
5. Classes Auxiliares 📋
SRPrice: Armazena dados fractais (índice, preço, valor do indicador).DivergenceFind: Rastrea detalhes da divergência (título, tempo, preços, cor).
6. Tratamento de Erros 🚨
O indicador verifica parâmetros inválidos (ex.: MinBarsValidation > MaxBarsValidation, PeriodFractal par) e exibe avisos na área do indicador usando DrawStaticText.
🛠️ Como Usar o Indicador Divergency11
Passo 1: Instalação 📥
- Baixe o Código: Copie o código C# fornecido.
- Adicione ao cTrader:
-
- Abra o cTrader e navegue até cAlgo > Indicadores.
- Clique em Novo e cole o código no editor.
- Compile o indicador (certifique-se de que não haja erros de compilação).
- Aplique ao Gráfico:
-
- Abra um gráfico no cTrader.
- Adicione o indicador Divergency11 da lista de indicadores.
Passo 2: Configure os Parâmetros ⚙️
Personalize as configurações para combinar com seu estilo de negociação:
- Escolha um Oscilador:
-
- Selecione um oscilador (ex.:
Relative_Strenght_Indexpara RSI) viaIndicatorSelection. - Ajuste
Value1(período),Value2(suavização) eValue3(período do sinal) conforme necessário.
- Selecione um oscilador (ex.:
- Defina o Tipo de Divergência:
-
- Use
Stratpara focar emDivergence,Hiden_Divergence,CorrelationouAll_Divergence.
- Use
- Fractal e Lookback:
-
- Defina
PeriodFractalpara um número ímpar (ex.: 5) para simetria. - Ajuste
LookBackpara controlar quantas divergências históricas são analisadas.
- Defina
- Zona e Níveis:
-
- Configure
ExtraLevelMineExtraLevelMaxpara zonas de sobrecompra/sobrevenda. - Defina
ExtraLevelLinepara ajustar os limites visuais.
- Configure
Passo 3: Interprete os Sinais 📊
- Divergência Regular:
-
- Alta (Lima): Sinal de baixa (preço faz máximas mais altas, oscilador faz máximas mais baixas).
- Baixa (Vermelho): Sinal de alta (preço faz mínimas mais baixas, oscilador faz mínimas mais altas).
- Divergência Oculta:
-
- Alta (Verde): Continuação de alta (preço faz máximas mais baixas, oscilador faz máximas mais altas).
- Baixa (Laranja): Continuação de baixa (preço faz mínimas mais altas, oscilador faz mínimas mais baixas).
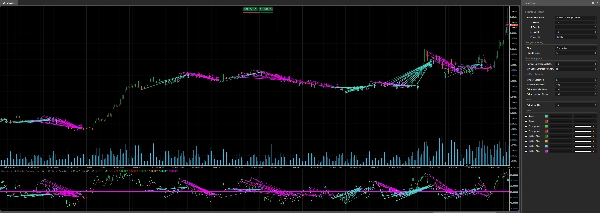
- Correlação:
-
- Alta (Turquesa): Tendência forte de alta (preço e oscilador subindo).
- Baixa (Magenta): Tendência forte de baixa (preço e oscilador caindo).
- Sinais Visuais:
-
- Linhas de tendência conectam pontos de divergência no gráfico e no indicador.
- Setas indicam a direção do sinal (para cima/para baixo).
- Texto exibe o número de divergências detectadas (se
LookBack > 1).
Passo 4: Estratégias de Negociação 💡
- Negociação de Reversão:
-
- Use divergências regulares (Lima/Vermelho) para identificar potenciais reversões.
- Confirme com outros indicadores (ex.: suporte/resistência, padrões de velas).
- Continuação de Tendência:
-
- Divergências ocultas (Verde/Laranja) sinalizam continuação da tendência.
- Entre em operações na direção da tendência após um pullback.
- Força da Tendência:
-
- Correlações (Turquesa/Magenta) confirmam tendências fortes.
- Use como filtro para evitar operações contra a tendência.
- Intervalo de Tempo:
-
- Funciona em qualquer intervalo, mas intervalos maiores (H1, H4) reduzem ruído.
- Gestão de Risco:
-
- Defina stop-loss abaixo das mínimas recentes (para compras) ou acima das máximas recentes (para vendas).
- Use o ATR (incluído no código) para dimensionar posições.
Passo 5: Otimização 🔧
- Backtest: Use o recurso de backtesting do cTrader para testar o indicador em dados históricos.
- Ajuste os Parâmetros: Experimente com
PeriodFractal,LookBackeMinCountDivergenceShowpara reduzir sinais falsos. - Combine Indicadores: Combine com indicadores de tendência (ex.: Médias Móveis) ou ferramentas de volatilidade (ex.: Bandas de Bollinger).
🌟 Dicas para o Sucesso
- Comece Simples: Inicie com configurações padrão e um oscilador familiar como o RSI.
- Pratique no Demo: Teste o indicador em uma conta demo para entender seus sinais.
- Monitore Alertas: Observe setas e linhas de tendência para agir rapidamente nos sinais.
- Evite Overtrading: Use divergências como parte de uma estratégia mais ampla, não isoladamente.
- Mantenha-se Atualizado: Verifique atualizações de código ou feedback da comunidade nos fóruns do cTrader.
⚠️ Problemas Comuns e Soluções
- Nenhum Sinal Aparece:
-
- Verifique
MinCountDivergenceShowvs.LookBack(o primeiro deve ser ≤ o segundo). - Certifique-se de que
PeriodFractalseja ímpar.
- Verifique
- Sinais em Excesso:
-
- Aumente
MinCountDivergenceShowou reduzaLookBack. - Aperte
MinBarsValidationeMaxBarsValidation.
- Aumente
- Mensagens de Erro:
-
- Revise avisos de parâmetros na área do indicador (ex.:
MinBarsValidation > MaxBarsValidation). - Corrija configurações inválidas e reaplique o indicador.
- Revise avisos de parâmetros na área do indicador (ex.:
🎉 Conclusão
O indicador Divergency v1.1 é uma ferramenta versátil e robusta para usuários do cTrader, oferecendo insights profundos sobre a relação preço-oscilador. Com suas configurações personalizáveis e saídas visuais claras, capacita os traders a identificar reversões, continuações e força da tendência com confiança. Experimente, ajuste os parâmetros e integre-o ao seu plano de negociação para elevar sua análise! 🚀
Boas negociações, e que seus gráficos estejam sempre verdes! 📈💚
Resumo
- Regular divergences signaling potential reversals when price and oscillator move oppositely.
- Hidden divergences indicating trend continuation with differing price and oscillator alignments.
- Correlations highlighting synchronized movements suggesting trend strength.
Signals are displayed on the chart and indicator window using colored lines, icons, and text for clarity. Visual cues include trend lines connecting divergence points and arrows indicating signal direction. Key functions handle initialization, calculation of normalized oscillator values, fractal detection, divergence analysis, and drawing of signals.
Users can configure overbought/oversold zones and adjust lookback periods to tailor signal sensitivity. The indicator works on any timeframe, with higher timeframes recommended to reduce noise. It includes error handling for invalid parameters and provides guidance for installation, parameter setup, signal interpretation, and trading strategies such as reversal and trend continuation. Backtesting and parameter optimization are supported within cTrader to refine performance.
Avaliações de clientes
5 | 100 % | |
4 | 0 % | |
3 | 0 % | |
2 | 0 % | |
1 | 0 % |


