
ADX and ADI
Индикатор
258 скачивания
Версия 1.0, Aug 2025
Windows, Mac
5.0
Отзывы: 2
Описание
Ключевые особенности:
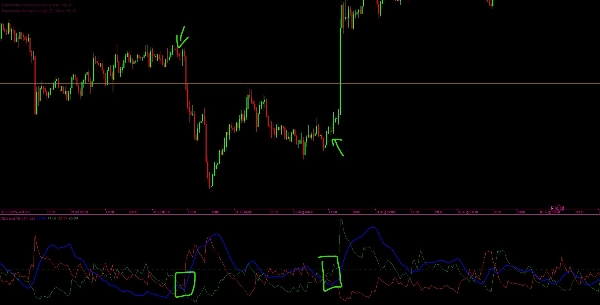
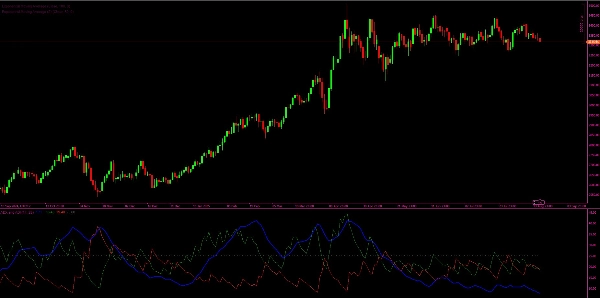
- Линия ADX и ADI (синяя): Показывает сглаженную силу текущего тренда, независимо от направления.
- Линия +DI (зеленая): Показывает силу восходящих движений.
- Линия -DI (красная): Показывает силу нисходящих движений.
- Пороговая линия (серая): Горизонтальный уровень отсчёта (по умолчанию 25), помогающий определить, является ли сила тренда значительной.
Как это работает:
- Индикатор вычисляет истинный диапазон (TR), положительное направленное движение (+DM) и отрицательное направленное движение (-DM).
- Применяет метод сглаживания Уайлдера для вычисления сглаженных значений TR, +DM и -DM.
- На основе этих данных вычисляются направленные индикаторы (+DI и -DI), показывающие, какая сторона (быки или медведи) имеет более сильный импульс.
- Вычисляется DX (направленный индекс) на основе относительной разницы между +DI и -DI.
- Наконец, ADX (средний направленный индекс) вычисляется как сглаженная версия DX, предоставляя меру общей силы тренда.
Интерпретация:
- Когда ADX выше порога (например, 25), рынок считается находящимся в сильном тренде.
- Когда +DI > -DI, быки контролируют рынок (восходящий тренд).
- Когда -DI > +DI, медведи контролируют рынок (нисходящий тренд).
- Когда ADX ниже порога, рынок считается находящимся в боковом движении (слабый или отсутствующий тренд).
Сводка
ИИ-сводка
This custom indicator provides a full implementation of the Average Directional Index (ADX) and Directional Indicators (DI) to measure trend strength and direction in financial markets. It displays four key lines: the ADX and ADI line (blue) representing smoothed trend strength regardless of direction; the +DI line (green) indicating upward movement strength; the -DI line (red) indicating downward movement strength; and a threshold line (gray, default 25) to identify significant trend strength.
The indicator calculates True Range (TR), Positive Directional Movement (+DM), and Negative Directional Movement (-DM), applying Wilder’s smoothing technique to derive smoothed values. From these, it computes the +DI and -DI lines to show bullish or bearish momentum. The Directional Index (DX) is calculated from the relative difference between +DI and -DI, and the ADX is a smoothed version of DX, quantifying overall trend strength.
Interpretation guidelines include: ADX above the threshold signals a strong trend; +DI greater than -DI indicates bullish control; -DI greater than +DI indicates bearish control; and ADX below the threshold suggests a ranging or weak trend market.
Профиль индикатора
Отзывы покупателей
5.0
Отзывы: 2
5 | 100 % | |
4 | 0 % | |
3 | 0 % | |
2 | 0 % | |
1 | 0 % |
Отзывы покупателей
December 1, 2025
ADX and ADI delivers clean trend strength and direction signals. ADX shows when the market is actually trending, while +DI and -DI reveal who’s in control. Stable, lightweight and reliable across all timeframes. Best on H1+ for smoother signals. Alerts and zone-highlighting would be great additions.
September 12, 2025
Обсуждение
Частые вопросы
Продукты, доступные в cTrader Store, включая торговых ботов, индикаторы и плагины, предоставляются сторонними разработчиками и доступны исключительно в информационных и технических целях. cTrader Store не является брокером и не предоставляет инвестиционные консультации, персональные рекомендации или какие-либо гарантии будущей доходности.


Цена
С 21/02/2025
466.3M
Торгуемый объем
180.83K
Выигранные пипы
22
Продажи
6.89K
Бесплатные установки