CicloQuatroVelas
Chỉ báo
109 lượt tải
Phiên bản 1.0, Aug 2025
Windows, Mac
Mô tả
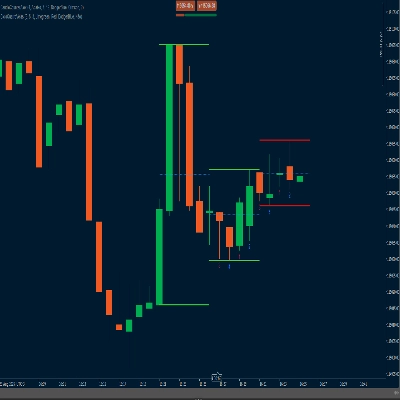
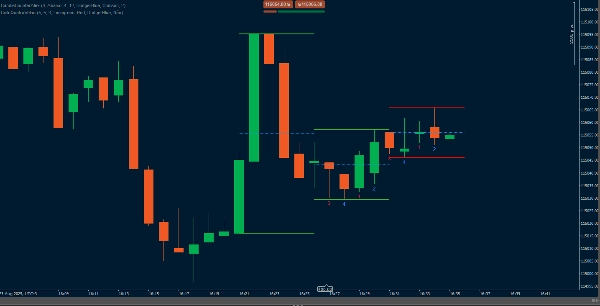
O Ciclo 4 Velas là một chỉ báo được phát triển để làm nổi bật một cách rõ ràng động lực của các chu kỳ nhỏ hoặc lớn trên biểu đồ.
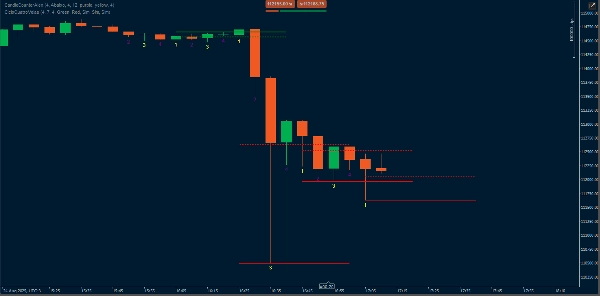
Mỗi chuỗi 4 nến hoặc nhiều hơn , chỉ báo tự động đánh dấu các đỉnh, đáy và 50% bằng các đường ngang, giúp việc đọc biến động giá trở nên đơn giản và rõ ràng.
🔹 Các tính năng chính:
- Tự động nhận diện các chu kỳ từ 4 nến trở lên
- Đường ngang được vẽ tại đỉnh và đáy của mỗi chu kỳ.
- Tự động loại bỏ các chu kỳ cũ, tránh làm rối mắt trên biểu đồ.
- Công cụ lý tưởng cho những ai muốn kỷ luật trong việc đọc xu hướng ngắn hạn.
- Quan trọng: tôi đã thêm đường 50% của mỗi biên độ để dễ dàng đọc hơn. Kết hợp chỉ báo này với bộ đếm nến. Rất tuyệt vời. !!!
- Bây giờ bạn có ba tham số bổ sung trong bảng điều khiển của chỉ báo:
- Xóa Cực Trước (giữ nguyên như trước).
- Hiển Thị Đỉnh/Đáy → BẬT/TẮT.
- Hiển Thị Đường 50% → BẬT/TẮT.
Như vậy bạn có thể chạy chỉ với đường 50%, hoặc chỉ với đỉnh/đáy, hoặc với tất cả cùng lúc.
💡 Chỉ báo này hữu ích cho cả việc nghiên cứu hành động giá lẫn các chiến lược dựa trên các xu hướng nhỏ.
Tóm tắt
Tóm tắt AI
CicloQuatroVelas is a technical indicator designed to identify and highlight price cycles consisting of four or more consecutive candlesticks on trading charts. It automatically marks the maximum and minimum price levels of each detected cycle with horizontal lines, as well as the midpoint (50%) of the amplitude, aiding in clear visualization of price movement dynamics. The indicator removes older cycles automatically to reduce chart clutter. Users can customize the display by toggling the visibility of maximum/minimum lines and the 50% midpoint line independently. This tool is suitable for analyzing short-term trends and microtrends, supporting studies based on price action. It is applicable across various markets including Forex, commodities, cryptocurrencies, and stocks.
Hồ sơ chỉ báo
Đánh giá của khách hàng
0.0
Đánh giá: 0
Đánh giá của khách hàng
Sản phẩm này chưa có đánh giá nào. Bạn đã dùng thử chưa? Hãy là người đầu tiên chia sẻ với mọi người!
Thảo luận
Câu hỏi thường gặp
Forex
Commodities
Crypto
Stocks
Các sản phẩm có sẵn trên cTrader Store, bao gồm bot giao dịch, chỉ báo và plugin, được cung cấp bởi các nhà phát triển bên thứ ba và chỉ nhằm mục đích cung cấp thông tin và tiếp cận kỹ thuật. cTrader Store không phải là nhà môi giới và không cung cấp lời khuyên đầu tư, khuyến nghị cá nhân hay bất kỳ đảm bảo nào về hiệu suất trong tương lai.
Sản phẩm khác của tác giả này


Giá
Kể từ 18/08/2025
1
Lượt bán
109
Cài đặt miễn phí