Описание
⚠️ Мы переехали на 👉 PrimeQuant
🚫🚫🚫 Не покупайте этот индикатор!
Этот OHLC PRO от LudwigICT индикатор представляет собой многофункциональный инструмент наложения на график, предназначенный для профессиональной, насыщенной информацией визуализации на вашем графике cTrader.
Вот краткое описание его функций:
🔹 Основная функция: наложение OHLC
- Рисует кастомные бары OHLC (открытие, максимум, минимум, закрытие) на вашем графике.
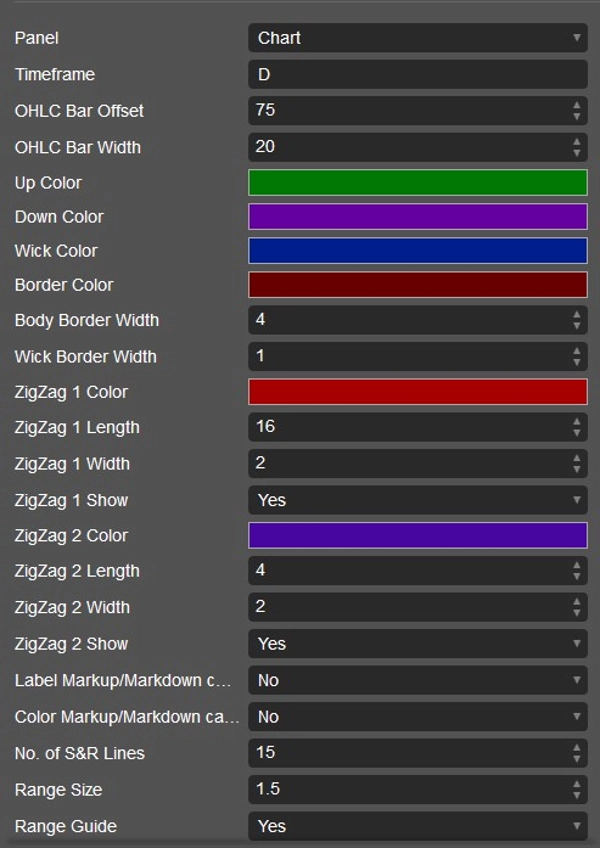
- Вы можете настроить:
-
- Какой таймфрейм OHLC использовать (дневной, недельный, месячный или внутридневной, например H1, M15 и т.д.).
- Смещение бара (расстояние от текущих свечей).
- Ширину бара, фитиль, границы и кастомные цвета.
- Фактически, вы получаете «эталонные свечи» с более высоких таймфреймов, размещённые на вашем текущем графике.
🔹 Настройка Triple-M (бычьи/медвежьи сигналы)
- Обнаруживает паттерн последовательных более высоких минимумов (бычий) или более низких максимумов (медвежий).
- При обнаружении:
-
- Может размещать иконки треугольников (вверх или вниз) на свечах.
- Также может перекрашивать бары для отображения смены импульса.
- Это действует как сигнал смены структуры импульса.
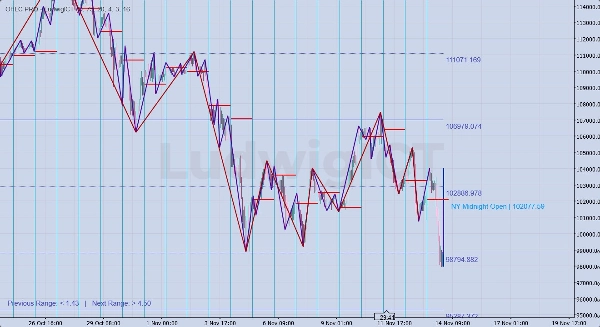
🔹 Двойные инструменты ZigZag
- Два независимых наложения ZigZag:
-
- ZigZag #1 (большая длина, например структура свинга).
- ZigZag #2 (короткая длина, например микро-свинги).
- Выделяет рыночные свинги для анализа структуры, тренда и пробоев.
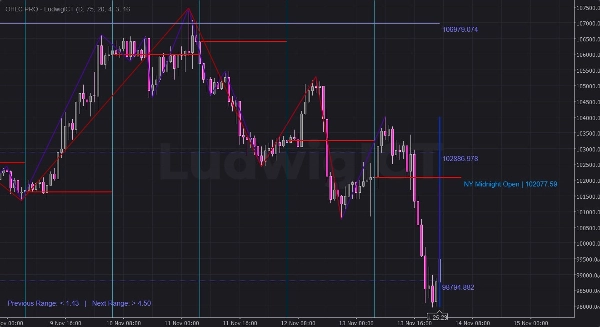
🔹 Уровни поддержки и сопротивления Ганна
- Использует таблицу чисел Ганна + логику ATR для расчёта уровней поддержки/сопротивления.
- Строит несколько линий поддержки/сопротивления выше и ниже цены.
- Линии можно стилизовать (сплошные, пунктирные, с продолжением влево и т.д.).
- Метки уровней с ценовыми значениями.
- Также предоставляет руководства по диапазонам:
-
- «Предыдущий диапазон» против «Следующего диапазона» относительно ATR.
- Помогает прогнозировать зоны расширения или сжатия.
🔹 Уровни полуночи Нью-Йорка
- Автоматически определяет цену открытия сессии Нью-Йорка в полночь.
- Рисует:
-
- Горизонтальную линию на цене открытия в полночь NY.
- Вертикальную линию в начале сессии.
- Метки с надписью «NY Midnight Open | цена».
- Вы можете продлить эти линии на 1 или 2 дня, или добавить дополнительные часы.
- Полезно для трейдинга в стиле ICT (смещение сессии Нью-Йорка, точки равновесия и т.д.).
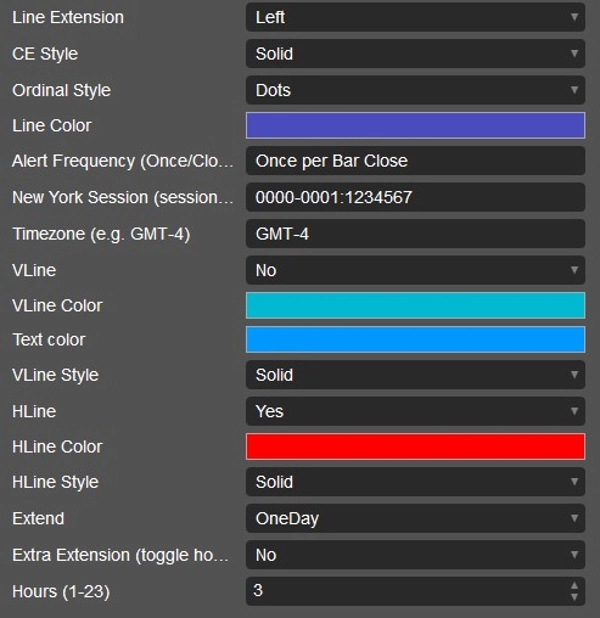
🔹 Настройка и оповещения
- Каждая функция имеет параметры в выпадающих списках:
-
- Цвета, стили, продолжения линий, количество линий и т.д.
- Поддерживаются оповещения (хотя в основном через визуальные элементы на графике — параметр частоты оповещений присутствует).
- Чистое удаление при закрытии индикатора (чтобы график не оставался загромождённым).
✅ Вкратце:
Этот индикатор — это многоцелевой инструмент для анализа ценового действия. Он объединяет:
- Свечи OHLC с более высоких таймфреймов
- Сигналы паттернов импульса (Triple-M)
- Две структуры ZigZag
- Уровни поддержки/сопротивления Ганна + руководства по диапазонам
- Маркировки открытия сессии Нью-Йорка в полночь
Он создан для торговли на основе структуры, сессий и уровней, особенно полезен для трейдеров в стиле ICT или по ценовому действию.
Я объясняю как вы можете практически использовать его при торговле XAU/USD
🔹 Практическое использование в торговле (золото с OHLC PRO)
1. Наложение OHLC с более высокого таймфрейма
- Пример: нанесите дневные OHLC при торговле на M5/M15.
- Вы увидите свечу вчерашнего дня «внутри» вашего внутридневного графика.
- Использование:
-
- Цена приближается к максимуму/минимуму предыдущего дня = зона охоты за ликвидностью.
- Открытие/закрытие дня = фильтр направления (выше = бычье, ниже = медвежье).
- Помогает торговать внутри дневного диапазона.
👉 По золоту сессия NY часто атакует максимум/минимум предыдущего дня перед разворотом.
2. Сигналы Triple-M
- Паттерн Triple-M (серия растущих минимумов или падающих максимумов) = краткосрочный импульс.
- Использование:
-
- Бычий Triple-M возле поддержки (низкий HTF или NY midnight open) → возможный короткий скальп.
- Медвежий Triple-M возле сопротивления (высокий HTF или уровень Ганна) → возможный короткий скальп.
- Может окрашивать бары для быстрого визуального распознавания при быстрых движениях золота.
👉 Хорошо работает для точечных входов снайпера на M1–M5 при согласовании с направлением HTF.
3. Двойной ZigZag
- ZigZag #1 (большая длина) = структура свинга.
- ZigZag #2 (короткая длина) = микро структура.
- Использование:
-
- Определяйте пробои структуры рынка (BOS/CHOCH).
- Торгуйте только в направлении большего ZigZag (#1).
- Используйте меньший ZigZag (#2) для подтверждения входа.
👉 Пример: дневной бычий тренд → ждите смены ZigZag #2 на бычий возле поддержки HTF.
4. Уровни поддержки и сопротивления Ганна
- Генерирует сетку математических уровней поддержки/сопротивления.
- Использование:
-
- Если цена консолидируется, уровни отмечают вероятные точки расширения пробоя.
- Комбинируйте с руководством по диапазону ATR:
-
- «Предыдущий диапазон» мал → ожидайте расширение волатильности.
- «Следующий диапазон» высок → впереди сильный уровень пробоя.
👉 По золоту уровни Ганна часто совпадают с круглыми числами (например, 2400, 2420, 2435).
5. Открытие Нью-Йорка в полночь
- Это один из самых мощных инструментов ICT для золота.
- Использование:
-
- Цена относительно открытия в полночь NY = направленное смещение.
- Если цена остаётся выше открытия в полночь → бычья сессия NY.
- Если ниже → медвежье смещение.
- Горизонтальная линия служит ссылкой на равновесие (50%).
- Следите за ликвидностью вокруг этого уровня в зонах убийства Лондона/Нью-Йорка.
👉 Пример:
Открытие NY в полночь = 2405.
- Если Лондон опускает цену до 2398, а NY возвращает 2405 → сильный бычий сетап.
🔑 Объединение (пример настройки)
- Начало сессии NY:
-
- Нанесите дневные OHLC.
- Отметьте открытие NY в полночь.
- Следите за уровнями Ганна поблизости.
- Ждите захвата ликвидности (атака дневного максимума/минимума или уровней Ганна).
- Проверьте Triple-M / ZigZag #2 для микробычьего/медвежьего подтверждения.
- Входите с ордером стоп за ликвидностью.
- Цельтесь в противоположную сторону диапазона или следующий уровень Ганна/HTF.
✅ Вкратце:
- Дневные OHLC + NY Midnight = фильтр направления.
- ZigZag + Triple-M = тайминг входа.
- Ганн + руководство по диапазону = цели по прибыли и сигналы расширения.
Этот индикатор фактически предоставляет вам все инструменты в стиле ICT в одном пакете для XAU/USD.
Если у вас есть вопросы или возникнут проблемы, не стесняйтесь обращаться ко мне. Я с радостью помогу вам!
Отказ от ответственности:
Используя мои алгоритмы, вы признаёте, что торговля связана с внутренними рисками и что прошлые результаты не гарантируют будущих. Важно иметь надёжную стратегию управления рисками и, прежде всего, дисциплинированно соблюдать уровни стоп-лосс. Неправильное управление рисками может привести к значительным потерям. Я не несу ответственности за финансовые результаты, возникающие в результате использования этих алгоритмов. Торгуйте ответственно и всегда следуйте правилам управления рисками.
Благословений! 🙌
Сводка
Отзывы покупателей
5 | 100 % | |
4 | 0 % | |
3 | 0 % | |
2 | 0 % | |
1 | 0 % |


