
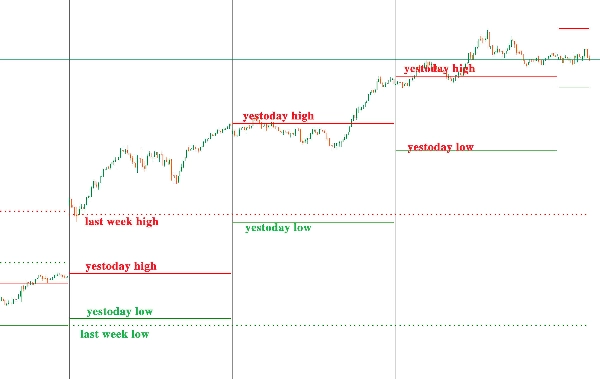
Индикатор "Daily Levels" используется для отображения максимумов/минимумов прошлой недели и максимумов/минимумов вчерашнего дня на разных таймфреймах.
Максимумы/минимумы прошлой недели: отмечены толстыми пунктирными линиями;
Максимумы/минимумы вчерашнего дня: отмечены тонкими сплошными линиями.
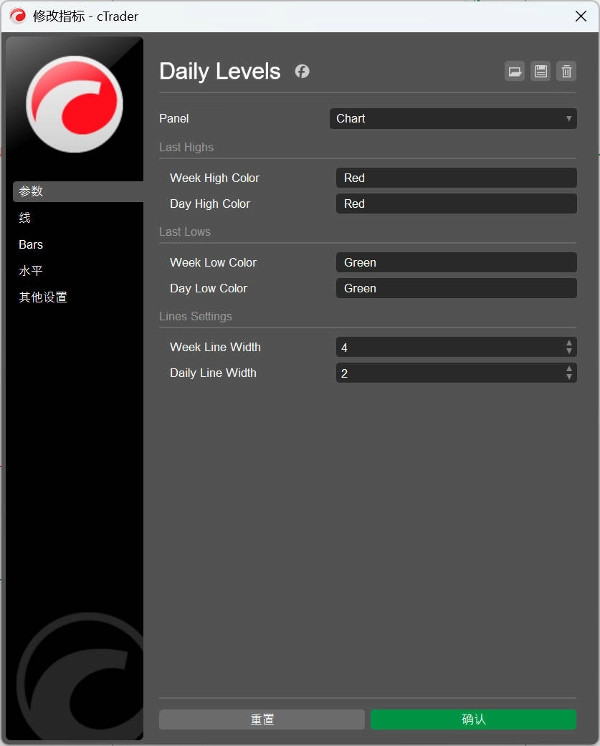
Пользователи могут настраивать цвета и толщину линий.
“Daily Levels”指标用于在不同的时框框架下显示上周最高价/最低价和昨天最高价/最低价。
上周最高/最低价:使用粗虚线标注;
昨天最高/最低价:使用细实线标注。
用户可以自定义颜色和线条粗细。
Профиль индикатора
0.0
Отзывы: 0
Отзывы покупателей
У этого продукта еще нет отзывов. Уже попробовали его? Поделитесь впечатлениями!
Forex
Signal
Breakout
Indices
Commodities
Crypto
Продукты, доступные в cTrader Store, включая торговых ботов, индикаторы и плагины, предоставляются сторонними разработчиками и доступны исключительно в информационных и технических целях. cTrader Store не является брокером и не предоставляет инвестиционные консультации, персональные рекомендации или какие-либо гарантии будущей доходности.
![Логотип продукта "[Hamster-Coder] Bollinger Bands"](https://cdn.ctrader.com/image/webp/21d8e5d6-fb11-4bac-b9ee-cd05c2b76804_30327)


![Логотип продукта "[CB] Pivot Points Pro"](https://cdn.ctrader.com/image/webp/43463c82-67b0-4f10-a4ba-901bba091d81_32594)


С 30/09/2024
44
Продажи