
WAVETREND_withSourceCode
Индикатор
Версия 1.0, Oct 2025
Windows, Mac
5.0
Отзывы: 2
Описание
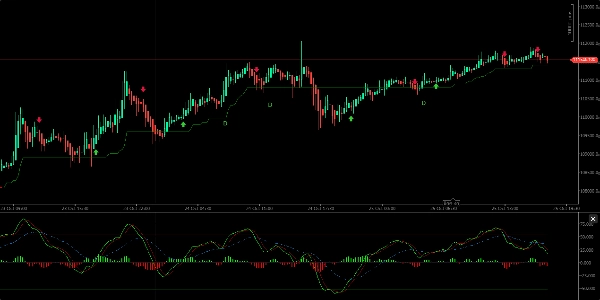
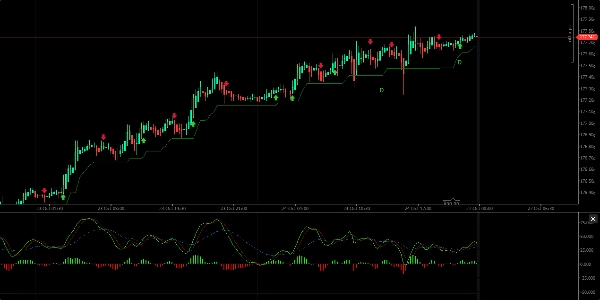
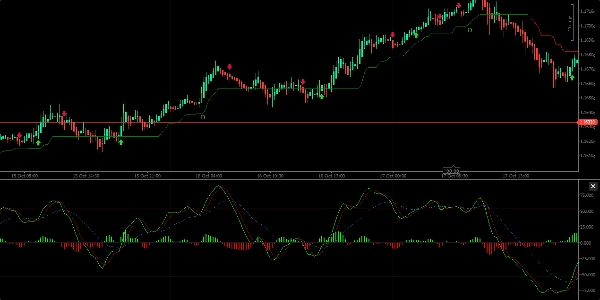
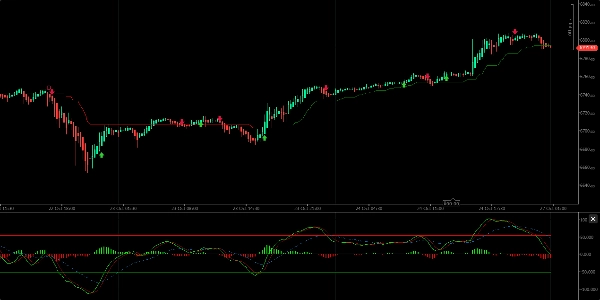
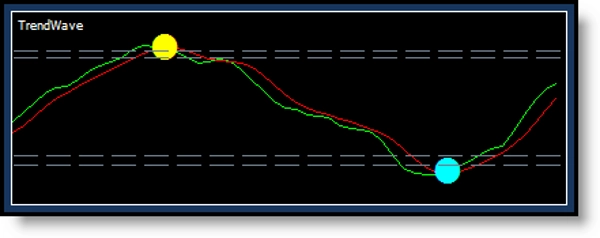
Он предоставляет сигналы покупки-продажи, указывает направление тренда и выявляет зоны перекупленности и перепроданности. Визуально он состоит из двух линий значений с облаком/гистограммой в центре, которая движется выше и ниже средней линии, представляя восходящие или нисходящие тренды.
Основные характеристики:
- Сигналы покупки возникают, когда зеленая линия пересекает красную линию вверх; сигналы продажи — когда зеленая линия пересекает вниз.
- Он показывает направление тренда с помощью волн облака выше или ниже средней линии.
- Индикатор отображает зеленые (покупка) и красные (продажа) точки на точках пересечения, с соответствующими изменениями цвета свечей (желтый для покупки, бирюзовый для продажи).
- Лучше всего использовать на интервалах 12 часов или 1 день, чтобы избежать чрезмерного краткосрочного шума.
- Индикатор может выявлять дивергенции между ценой и импульсом (обычные бычьи и медвежьи дивергенции), сигнализируя о возможных разворотах цены.
- Рекомендуется сочетать WaveTrend с другими индикаторами, такими как WMA, CMF, RSI и MACD, для более надежных торговых решений.
В целом, WaveTrend — это функциональный инструмент, полезный для определения направления тренда и торговых сигналов, но его следует использовать вместе с другими инструментами анализа для подтверждения.
Сводка
Профиль индикатора
Отзывы покупателей
5.0
Отзывы: 2
5 | 100 % | |
4 | 0 % | |
3 | 0 % | |
2 | 0 % | |
1 | 0 % |
Отзывы покупателей
November 6, 2025
the main upside is the trade idea gets slowed down first. The setup still needs say no.
Обсуждение
Частые вопросы
Signal
ZigZag
EURUSD
Supertrend
GBPUSD
RSI
XAUUSD
NAS100
ATR
MACD
Продукты, доступные в cTrader Store, включая торговых ботов, индикаторы и плагины, предоставляются сторонними разработчиками и доступны исключительно в информационных и технических целях. cTrader Store не является брокером и не предоставляет инвестиционные консультации, персональные рекомендации или какие-либо гарантии будущей доходности.


Цена
С 16/03/2025
256
Бесплатные установки