Описание
PnL Studio
Преобразуйте историю своих сделок в cTrader в визуальную панель производительности и мгновенно увидьте торговые паттерны, сильные стороны и области для улучшения.
PnL Studio — мощный аналитический плагин, который превращает вашу историю сделок в понятную визуальную панель. Вместо того чтобы просматривать длинные списки сделок, вы можете быстро понять, как работает ваша торговля по дням, неделям и стратегиям.
С помощью календарного отслеживания производительности, ключевых статистик и инструментов детального анализа сделок PnL Studio помогает трейдерам анализировать результаты и выявлять паттерны, которые могут улучшить принятие решений.
Ключевые функции
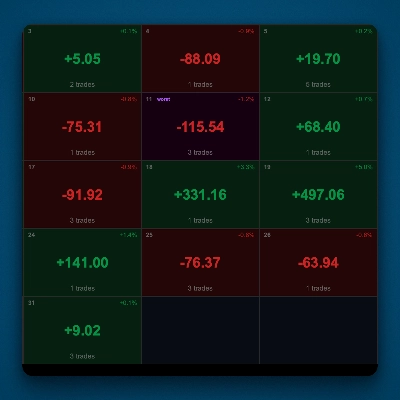
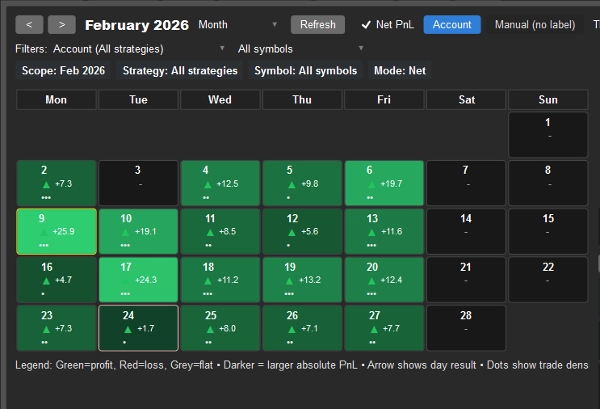
Визуальный календарь торговой производительности
Мгновенно увидьте, как прошёл каждый торговый день с помощью цветовой карты тепла календаря.
• Зелёный = прибыльные дни
• Красный = убыточные дни
• Более тёмные цвета = больший PnL
• Индикаторы активности показывают интенсивность торговли
• Стрелки направления выделяют выигрышные или проигрышные дни
Нажмите на любой день, чтобы подробно изучить сделки, которые дали этот результат.
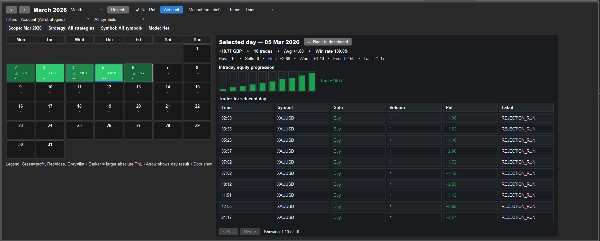
Обзор сделок по дням
Выберите любой день в календаре, чтобы проверить точные сделки, стоящие за результатом.
Просмотр:
• Список сделок с символом, направлением, объёмом и PnL
• Метка стратегии для каждой сделки
• Внутридневная динамика капитала
• Статистика дня, включая лучшую сделку, худшую сделку и процент побед
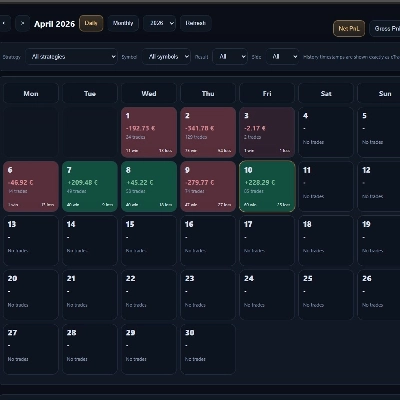
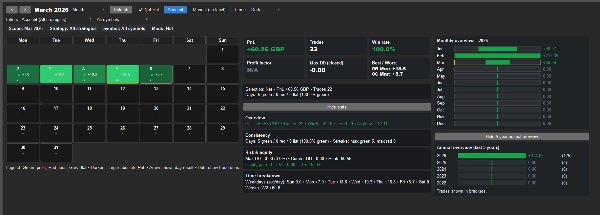
Ежемесячная панель производительности
Быстро оцените свою ежемесячную торговую производительность с ключевыми метриками, включая:
• Общий PnL
• Количество сделок
• Процент побед
• Коэффициент прибыли
• Максимальная закрытая просадка
• Лучшие и худшие торговые дни
Фильтрация по стратегиям и символам
Анализируйте конкретные стратегии или рынки с помощью гибких фильтров.
Фильтруйте результаты по:
• Метке стратегии
• Символу
• Валовой или чистой прибыли (PnL)
• Временному интервалу (месяц или год)
Обзор производительности стратегии
Автоматически суммирует результаты по каждой метке стратегии, чтобы вы могли быстро сравнить производительность.
Включает:
• Общая прибыль
• Средний результат сделки
• Количество сделок
• Рейтинг силы стратегии
Долгосрочные аналитические данные
Отслеживайте стабильность с течением времени с помощью встроенных сводок, включая:
• Ежемесячный обзор за текущий год
• Разбивка годовой производительности за пять лет
Создан для трейдеров, желающих глубже понять
Независимо от того, торгуете ли вы вручную или используете автоматические стратегии, PnL Studio помогает понять, как ваша торговля работает со временем.
Используйте его для:
• Определения прибыльных торговых дней
• Выявления паттернов производительности
• Анализа поведения стратегии
• Мониторинга стабильности торговли
Работает вместе с другими инструментами AWTrades:
PnL Studio является частью более широкого набора инструментов AWTrades, предназначенного для того, чтобы помочь трейдерам лучше понимать как производительность, так и риск.
Вы можете использовать его вместе с:
• Risk Watch – плагин для мониторинга риска в реальном времени, показывающий текущую экспозицию, риск в худшем случае и концентрацию открытых позиций по вашему счёту.
• Trade Analytics – продвинутая панель, оценивающая статистическое качество вашего торгового преимущества, включая ожидаемую прибыль, стабильность и концентрацию прибыли.
Вместе эти инструменты создают более полный торговый рабочий процесс:
PnL Studio – визуальный обзор производительности
Risk Watch – мониторинг риска и экспозиции в реальном времени
Trade Analytics – анализ качества и устойчивости преимущества
Простой и лёгкий
PnL Studio работает прямо внутри cTrader и не требует внешнего программного обеспечения.
Просто откройте вкладку PnL Studio, чтобы мгновенно визуализировать и анализировать свою торговую производительность.
Сводка
Отзывы покупателей
5 | 33 % | |
4 | 67 % | |
3 | 0 % | |
2 | 0 % | |
1 | 0 % |