Median Trend Pro
Chỉ báo phân tích xu hướng chuyên nghiệp sử dụng các phép tính Trung vị Động tiên tiến để cung cấp các tín hiệu hướng thị trường chính xác. Được thiết kế cho các nhà giao dịch tìm kiếm phát hiện xu hướng rõ ràng, đáng tin cậy mà không làm rối biểu đồ.
TÍNH NĂNG CHÍNH:
• Trung vị Động Tiên tiến: Tính toán giá trị trung vị thực để phân tích xu hướng chính xác hơn
• Tín hiệu Xu hướng Rõ ràng: Các chỉ báo hướng tăng/giảm/trung lập trực quan
• Quản lý Biểu đồ Tự động: Hệ thống tự làm sạch duy trì hiệu suất tối ưu
• Cài đặt Tùy chỉnh: Thời kỳ, màu sắc và loại giá có thể điều chỉnh
• Giao diện Trực quan Sạch sẽ: Hiển thị không vẽ lại, không trễ
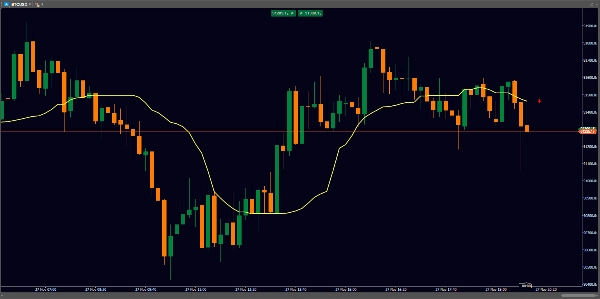
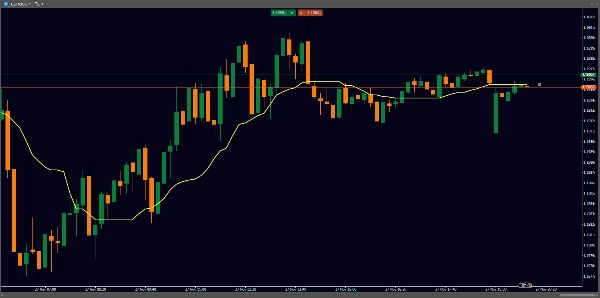
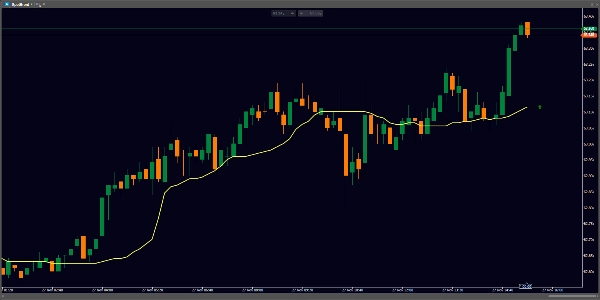
CÁCH HOẠT ĐỘNG:
Chỉ báo phân tích hành động giá sử dụng thuật toán Trung vị Động tinh vi lọc nhiễu thị trường trong khi vẫn duy trì khả năng phản ứng với sự thay đổi xu hướng. Nó cung cấp các tín hiệu trực quan rõ ràng qua các mũi tên xu hướng màu sắc và đường trung vị mượt mà, giúp nhận diện xu hướng nhanh chóng và chính xác.
LỢI ÍCH:
- Loại bỏ các tín hiệu sai phổ biến với trung bình động đơn giản
- Hoạt động trên tất cả các khung thời gian và công cụ
- Nhẹ và hiệu quả - không làm chậm hệ thống
- Hoàn hảo cho các chiến lược theo xu hướng và đảo chiều
PHÙ HỢP CHO:
Các nhà giao dịch theo xu hướng, giao dịch swing và giao dịch vị thế tìm kiếm xác nhận xu hướng đáng tin cậy và phát hiện thay đổi hướng sớm.
THÔNG SỐ KỸ THUẬT:
- Chỉ báo phủ (vẽ trực tiếp lên biểu đồ giá)
- Tương thích với cTrader Desktop
- Hỗ trợ tất cả các công cụ giao dịch
- Tối ưu hóa cho hiệu suất


