Описание
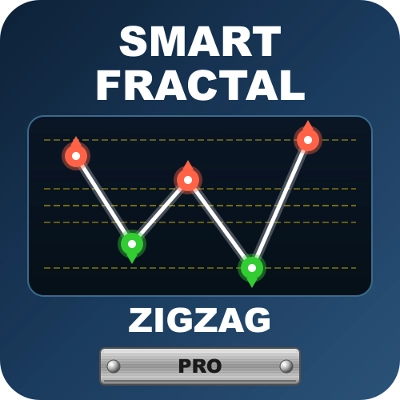
SmartFractalZigZag Pro — Умные фракталы, ZigZag и Авто Фибоначчи
════════════════════════════════════════════════════════════════════════════════
ОБЗОР ПРОДУКТА
SmartFractalZigZag Pro — это полный инструмент для анализа структуры рынка и Фибоначчи для cTrader.
Он сочетает в себе стабильный во времени фрактальный движок, чистые колебания ZigZag и полностью автоматические уровни Фибоначчи (коррекции/расширения) в одном индикаторе. Все уровни привязаны только к структурно валидным экстремумам колебаний, поэтому вы работаете с настоящими экстремумами, а не с внутренним шумом баров.
════════════════════════════════════════════════════════════════════════════════
СРАВНЕНИЕ ФУНКЦИЙ (Pro против Plus)
И Pro, и Plus включают:
• Умное обнаружение фракталов и фильтрация по направлению
• Соединения колебаний ZigZag
• Автоматический Фибоначчи в реальном времени
Функции только для Plus:
• Динамические зоны поддержки/сопротивления (тепловая карта плотности KDE)
• Конфлюенс поддержки/сопротивления на старших таймфреймах
• Трендовый индекс поддержки/сопротивления (индекс быков/медведей + панель)
════════════════════════════════════════════════════════════════════════════════
ОСНОВНЫЕ ФУНКЦИИ
────────────────────────────────────────────────────────────────────────────────
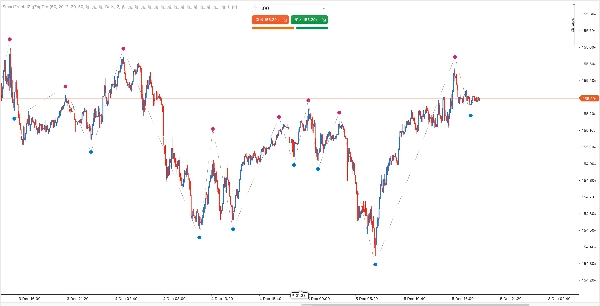
1. УМНОЕ ОБНАРУЖЕНИЕ ФРАКТАЛОВ
Фракталы являются основой анализа структуры рынка — они определяют локальные экстремумы цены (максимумы и минимумы колебаний).
SmartFractalZigZag использует стабильный во времени фрактальный движок с настраиваемой чувствительностью, чтобы вы могли адаптировать обнаружение под скальпинг, внутридневную, свинг или позиционную торговлю. Параметры Left Bars и Right Bars позволяют сделать движок более или менее избирательным без изменения общей логики стратегии.
Рекомендуемые настройки в зависимости от стиля торговли:
• Скальпинг: Left 3 / Right 2
• Внутридневная: Left 5 / Right 3
• Свинг: Left 10 / Right 5
• Позиционная: Left 20 / Right 10
────────────────────────────────────────────────────────────────────────────────
2. УМНАЯ ФИЛЬТРАЦИЯ ПО ОДНОМУ НАПРАВЛЕНИЮ
Когда несколько последовательных фракталов появляются в одном направлении, индикатор сохраняет только настоящий экстремум (самый высокий максимум для восходящих фракталов, самый низкий минимум для нисходящих).
Это обеспечивает чистую последовательность Максимум–Минимум–Максимум–Минимум и облегчает чтение структуры.
────────────────────────────────────────────────────────────────────────────────
3. КОЛЕБАНИЯ ZIGZAG
Соединяет отфильтрованные фрактальные точки в колебания, ясно показывая направление тренда и границы колебаний с первого взгляда.
────────────────────────────────────────────────────────────────────────────────
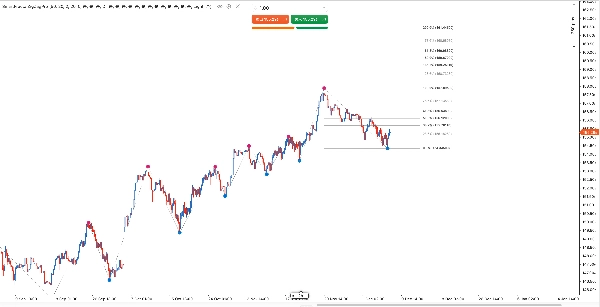
4. АВТОМАТИЧЕСКИЙ ФИБОНАЧЧИ В РЕАЛЬНОМ ВРЕМЕНИ
Автоматически рисует уровни коррекции и расширения Фибоначчи на основе последнего колебания:
• Автоматические якоря – всегда привязаны к подтверждённым структурным максимумам/минимумам
• Динамическое обновление – уровни корректируются в реальном времени по мере формирования новой структуры
• Полный набор часто используемых уровней коррекции и расширения (включая отрицательные расширения для продолжения тренда), все индивидуально настраиваемые
────────────────────────────────────────────────────────────────────────────────
5. ПОДДЕРЖКА ТЕМЫ
Встроенная поддержка светлой и тёмной темы, которая автоматически подстраивается под фон графика.
════════════════════════════════════════════════════════════════════════════════
ДЛЯ КОГО ЭТО?
• Внутридневные и свинг-трейдеры, которые хотят чистую, исторически последовательную структуру и точные якоря Фибоначчи
• Трейдеры SMC/ICT, которые полагаются на зоны OTE и конфлюенс структуры
• Дискреционные трейдеры, уставшие от ручного рисования уровней Фибоначчи
════════════════════════════════════════════════════════════════════════════════
ПОЧЕМУ SMARTFRACTALZIGZAG PRO?
Проблема: Рисование Фибоначчи вручную медленное и подвержено ошибкам
Решение: Автоматически обнаруживает колебания и поддерживает уровни Фибоначчи в актуальном состоянии
Проблема: Перерисовка фракталов искажает сигнал
Решение: Нет логики, смотрящей в будущее – все фракталы подтверждаются только на закрытых барах
Проблема: Слишком много отдельных инструментов загромождают график
Решение: Один индикатор объединяет фракталы + ZigZag + Фибоначчи
Проблема: Якоря, выбранные на глаз, непоследовательны
Решение: Строгий фрактальный движок гарантирует, что якоря — это математически точные максимумы/минимумы
════════════════════════════════════════════════════════════════════════════════
РАБОТАЕТ С ЛЮБОЙ МЕТОДОЛОГИЕЙ
• SMC / ICT – BOS, CHoCH, точки колебаний, зоны OTE
• Волны Эллиотта – Поворотные точки колебаний и расширения Фибоначчи
• Теория Доу – Более высокие максимумы / более низкие минимумы
• Вайкофф – Зоны спроса/предложения, пружины
• Теория Чана – Пены и сегменты
• Фибоначчи – Автоматически нарисованные уровни, без ручной работы
════════════════════════════════════════════════════════════════════════════════
ПАРАМЕТРЫ
────────────────────────────────────────────────────────────────────────────────
1. Настройки фракталов
• Left Bars – Баров слева для сравнения (по умолчанию: 20)
• Right Bars – Баров справа для подтверждения (по умолчанию: 2)
Отображение фракталов:
• Цвет восходящего фрактала – по умолчанию: DeepPink
• Цвет нисходящего фрактала – по умолчанию: DodgerBlue
• Размер фрактала – по умолчанию: 20
• Смещение фрактала (в пунктах) – по умолчанию: 50
• Показать фракталы – по умолчанию: ВКЛ
Настройки фильтра:
• Фильтр последовательных – Умная фильтрация по одному направлению, предпосылка для ZigZag и Фибоначчи (по умолчанию: ВКЛ)
────────────────────────────────────────────────────────────────────────────────
2. Настройки ZigZag
• Включить ZigZag – по умолчанию: ВКЛ
• Цвет ZigZag – по умолчанию: Серый
• Стиль ZigZag – по умолчанию: Точки
• Толщина ZigZag – по умолчанию: 2
────────────────────────────────────────────────────────────────────────────────
3. Настройки Фибоначчи
• Включить Фибоначчи – главный переключатель (по умолчанию: ВКЛ)
• Показать метки – показывать ценовые метки (по умолчанию: ВКЛ)
• Переключатели уровней – 19 отдельных переключателей для уровней от -100% до 200% (основные уровни включены по умолчанию)
────────────────────────────────────────────────────────────────────────────────
4. Настройки отображения и темы
• Правое смещение – количество баров пространства справа (по умолчанию: 10)
• Цветовая тема – светлая / тёмная (по умолчанию: светлая)
────────────────────────────────────────────────────────────────────────────────
5. Другие настройки
• Принудительная очистка всех экземпляров – по умолчанию: ВЫКЛ
════════════════════════════════════════════════════════════════════════════════
ПЕРЕХОД НА PLUS
Если вам также нужны:
• Динамические зоны поддержки/сопротивления на основе кластеризации плотности фракталов и алгоритма KDE
• Автоматический конфлюенс поддержки/сопротивления на нескольких таймфреймах, который выделяет, когда зоны старших таймфреймов поддерживают текущий график
• Трендовый индекс поддержки/сопротивления (индекс силы быков/медведей + панель), который агрегирует силу ближайших уровней поддержки и сопротивления в один удобочитаемый индикатор
тогда рассмотрите возможность перехода на SmartFractalZigZag Plus — он расширяет тот же базовый движок в полноценный рабочий процесс структуры + математики + динамической поддержки/сопротивления + конфлюенса на старших таймфреймах.
════════════════════════════════════════════════════════════════════════════════
ВАЖНЫЕ ЗАМЕЧАНИЯ
ПОВЕДЕНИЕ КОЛЕБАНИЙ (Стабильная история по дизайну)
Индикатор построен так, чтобы сохранять подтверждённые колебания стабильными в истории, при этом позволяя активной ноге реагировать на новое ценовое движение. Как только колебание структурно подтверждено, его якорные точки фиксируются; адаптироваться может только ещё формирующаяся нога по мере развития рынка.
ЗАВИСИМОСТИ ПЕРЕКЛЮЧАТЕЛЕЙ
ZigZag и Фибоначчи требуют включения фильтра последовательных. Если вы его отключите, будут отображаться только необработанные фрактальные точки, а ZigZag и Фибоначчи будут отключены.
ПРОБНАЯ ВЕРСИЯ
Доступна 7-дневная пробная версия через cTrader Store, чтобы вы могли протестировать индикатор на своих символах и таймфреймах перед покупкой.
════════════════════════════════════════════════════════════════════════════════
ПОДДЕРЖКА
Если у вас есть вопросы или отзывы, пожалуйста, свяжитесь с нами через cTrader Store.
Спасибо, что выбрали SmartFractalZigZag Pro!
Сводка
Отзывы покупателей
5 | 100 % | |
4 | 0 % | |
3 | 0 % | |
2 | 0 % | |
1 | 0 % |