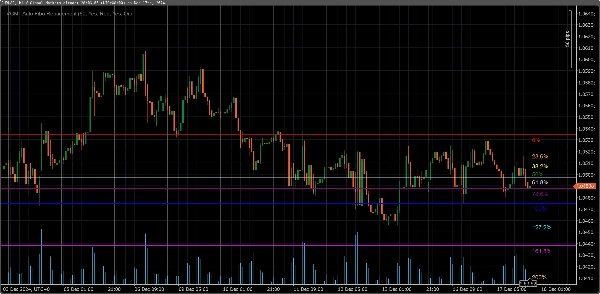
VGM - Auto Fibo Retracement
Логотип продукта "VGM - Auto Fibo Retracement"
С 17/12/2024
Бесплатные установки
966
Загруженное изображение продукта "VGM - Auto Fibo Retracement"

This Auto Fibonacci Retracement Indicator automatically calculates and draws Fibonacci retracement levels on the chart based on the highest high and lowest low within a customizable lookback period. Users can configure colors and enable/disable specific Fibonacci levels, including popular extensions above 100% such as 127.2%, 161.8%, 200%, and 261.8%.

Key Features:
1. **Automatic Swing Detection**: Detects swing highs and lows dynamically within the chosen lookback period.
2. **Customizable Levels**: Enable/disable specific Fibonacci levels as per preference.
3. **Color Settings**: Choose individual colors for each level for better visual distinction.
4. **Extended Levels**: Includes commonly used extensions (127.2%, 161.8%, 200%, and 261.8%) for trend continuation analysis.
5. **Real-Time Updates**: Levels automatically adjust to changes in market conditions.

Ideal For:
- Traders using Fibonacci retracement and extensions for entry/exit levels.
- Users who need a clean, flexible, and automated Fibonacci tool.


Build by VantoFX. https://vantofx.com Free for all.

3.3
Отзывы: 3
5
33 %
4
33 %
3
0 %
2
0 %
1
33 %
Отзывы покупателей
January 21, 2026
Sadly this iindicator makes drawings like trend lines, horizobtal lines, Fibonacci etc disappear within a second of traying to draw them. Obviously a problem with the coding so fix it and it would be worth a 5*
August 10, 2025
This is helpful my friend, thanks for the upload :)
July 9, 2025
Pros: Automatically detects swing points and plots Fibonacci retracement levels. Easy to use, customizable, works across timeframes. Cons: No tooltips or alerts. Lacks template saving and historical swing tracking. Requires additional confirmation tools for reliable trading.
Вам также может понравиться
[Stellar Strategies] Inside Bar with Signals
Visually master the Inside Bar strategy with clear breakout signals and professional chart highlighting 📈🔔📉
Alert Positioner
Auto Fill Alert on all Ur Markings. **Easy to mark on multiple devices using Alerts' Position
Multi Volume Profile
Advanced customizable volume-profile indicator with buy/sell levels, delta analysis, multi-TF support and vivid gradient
Machine Learning Momentum Index
The Machine Learning Momentum Index (MLMI) represents the next step in oscillator trading.
Высокий рейтинг
Бесплатно
market session
Market session indicator (Asia, Frankfurt, New York, London)
AutoLines™ Support & Resistance
FlexSR auto‑detects pivot highs/lows to plot dynamic support & resistance lines Features customizable styling and option
Round Number
Plots automatic psychological levels at round-number zones – major structure & liquidity levels.
Популярный
$ 29
Индикатор
NAS100
NZDUSD
XAUUSD
+16
Swing AVWAP Pro
Adaptive Swing-Anchored VWAP that tracks market structure shifts with precision and clarity.
Repiptor BB Width
Bollinger Bands Width
Индикатор
NAS100
NZDUSD
RSI
+13
Multi Timeframe Trend Scanner
Multi Timeframe Trend Scanner 🔍 EMA+RSI+ATR heatmap with clear BUY/SELL bias from M5 up to D1.
Индикатор
Forex
Fibonacci
VegaXLR - Analysis Tools Alerts
Enhance your trading with customizable alerts and dynamic visual tools for trendlines, Fibonacci levels, and more.
Индикатор
NAS100
NZDUSD
XAUUSD
+11
XABCD Master Detector
🚨Detection of geometric price patterns (Harmonic Patterns) and market structures based on price action📈
Популярный
$ 15
/
$30
Индикатор
RSI
Breakout
XAUUSD
+1
ZigzagSR
Automatic ZigZag swings with dynamic support & resistance levels, labeling highs/lows for clear trend signals.
Индикатор
Grid
NAS100
NZDUSD
+15
EMA UP&DOWN 2025
SectorIndex Dual Moving Average Indicator: Your Market Compass 🧭
Break of Structure
The Break of Structure (BoSCHoCh) Indicator is a smart market structure tool designed to help traders easily spot trend.
Индикатор
NAS100
NZDUSD
XAUUSD
+10
Smart Trend Scanner
Auto-draws filled trendline zones and detects breakouts with alerts.
Fibonacci Prediction Channel
Designed to plot a future prediction channel based on Fibonacci retracement levels 📊
Индикатор
Breakout
Stocks
Signal
Darvas Box
The Darvas Box involves identifying "boxes" or trading ranges where a stock's price consolidates before breaking out.