
Описание
Преобразуйте свой технический анализ с помощью самого продвинутого медианного индикатора на cTrader!
VMM Average Median — революционное развитие классического медианного индикатора, созданное для профессиональных трейдеров, которые требуют точности, скорости и надежности. Благодаря оптимизированным алгоритмам и интеллектуальному обнаружению тренда этот индикатор обеспечивает реальное конкурентное преимущество на финансовых рынках.
🎯 УМНОЕ ОБНАРУЖЕНИЕ ТРЕНДА
Настраиваемый алгоритм (2-5 баров) для разных стилей торговли
Продвинутый фильтр шума — игнорирует доджи и незначительные свечи
Точные стрелки с настраиваемым смещением
Улучшенная логика «Smart Price» для лучшего качества сигналов
🎨 ПОЛНАЯ НАСТРОЙКА
Более 15 регулируемых параметров для любой стратегии
Полностью настраиваемые цвета, стили и толщины
Тонкий контроль баланса между производительностью и точностью
Интуитивно понятный интерфейс, организованный в логические группы
📊 ПРЕИМУЩЕСТВА ДЛЯ ТРЕЙДЕРОВ
⚡ Для скальперов и дейтрейдеров:
Сверхбыстрая реакция (миллисекунды)
Мгновенное обнаружение разворотов
Минимальное потребление ресурсов
Идеально для тиковых и минутных графиков
📈 Для свинг-трейдеров и инвесторов:
Более надежный анализ тренда
Сложная фильтрация шума
Стабильная работа на длительных периодах
Идеально для нескольких таймфреймов
💻 Для пользователей VPS/нескольких пар:
До 80% снижение использования ЦП
Оптимизированное использование памяти
Одновременное выполнение без задержек
Реальная экономия на хостинге
🔧 ПРОДВИНУТЫЕ ТЕХНИЧЕСКИЕ ХАРАКТЕРИСТИКИ
Интеллектуальная система кэширования:
Эффективность кэша: 85-95% при обычном использовании
Периодическая автоочистка
Потокобезопасность с ConcurrentDictionary
Оптимизации алгоритма:
Оптимизированный расчет медианы O(n log n)
Предварительное выделение памяти для максимальной скорости
Надежная проверка границ
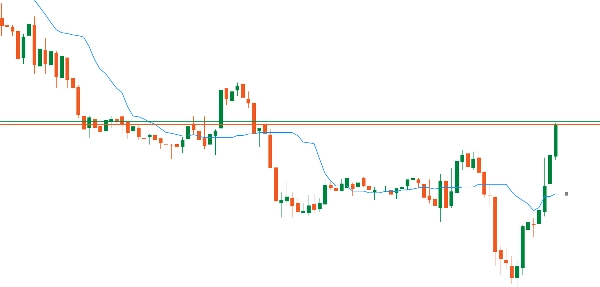
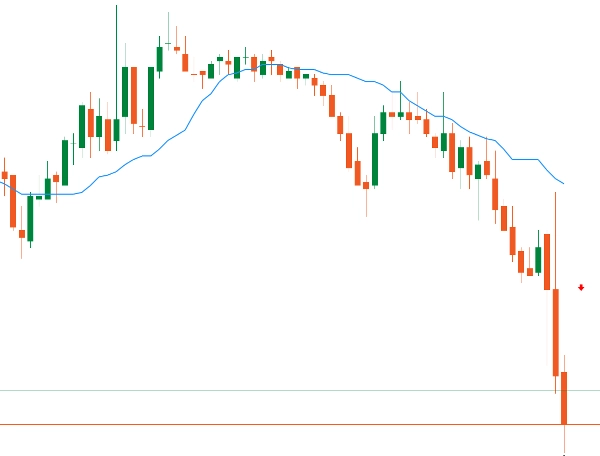
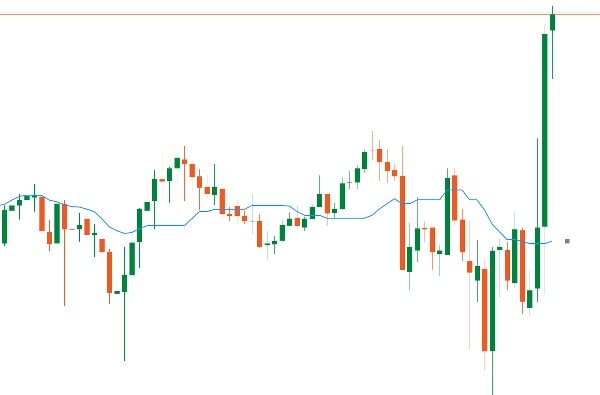
Профессиональная визуализация:
Плавные и непрерывные линии медианы
Стрелки тренда с умным позиционированием
Разнообразные стили линий (сплошные, пунктирные и др.) Настраиваемые цвета для бычьих/медвежьих рынков
МЕДИАНА против SMA: РЕАЛЬНЫЕ ПРЕИМУЩЕСТВА
📊 КАК ЭТО РАБОТАЕТ:
SMA: Простое среднее — суммирует все цены (включая выбросы)
МЕДИАНА: Центральное значение после сортировки — автоматически игнорирует всплески
🎯 БЫСТРЫЙ ПРИМЕР:
Цены: 100, 101, 102, 103, 150 (всплеск)
SMA: 111.2 ❌ (искажено всплеском)
МЕДИАНА: 102 ✅ (реальная рыночная цена)
⭐ ОСНОВНЫЕ ПРЕИМУЩЕСТВА:
1️⃣ ЕСТЕСТВЕННЫЙ ФИЛЬТР — Автоматически игнорирует выбросы/всплески
2️⃣ ЧИЩЕ СИГНАЛЫ — на 40-60% меньше ложных оповещений
3️⃣ УСТОЙЧИВА К МАНИПУЛЯЦИЯМ — пампы/дампы оказывают меньшее влияние
4️⃣ ИДЕАЛЬНА ДЛЯ ВОЛАТИЛЬНОСТИ — Сохраняет стабильность на хаотичных рынках
🔥 ДЛЯ ТРЕЙДЕРОВ:
Скальпинг: Фильтрует высокочастотный шум
Дейтрейдинг: Более точное время входа
Свинг: Определяет реальные тренды, а не шум
🚀 МЕДИАНА — УМНАЯ SMA — Показывает РЕАЛЬНЫЙ консенсус цены!


