present
Zarejestruj się i otrzymaj 50 $ zniżki na pierwszy zakup
Trading product for Deviation Trend Profile Wskaźnik Prop Forex, image 1
Deviation Trend Profile
Wskaźnik
Wersja 1.0, Jan 2026
Windows, Mac
4.6
Opinie: 5
Trading product for Deviation Trend Profile Wskaźnik Prop Forex, image 2
Trading product for Deviation Trend Profile Wskaźnik Prop Forex, image 3
Trading product for Deviation Trend Profile Wskaźnik Prop Forex, image 4
Trading product for Deviation Trend Profile Wskaźnik Prop Forex, image 5
Od 14/07/2025
71
Sprzedaż

Opis

Wskaźnik profilu trendu odchylenia

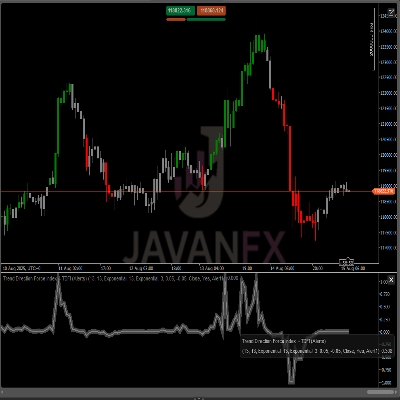
Narzędzie do śledzenia trendów, które pokazuje obszary ruchu cen oraz miejsca, gdzie ceny spędzają najwięcej czasu, z sygnałami zmieniającymi kolor i alertami dźwiękowymi przy zmianie kierunku trendu.

🎯 JAK TO DZIAŁA

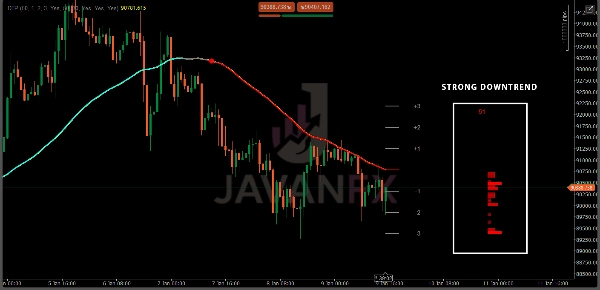
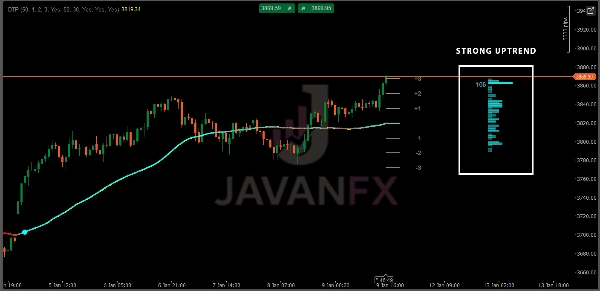
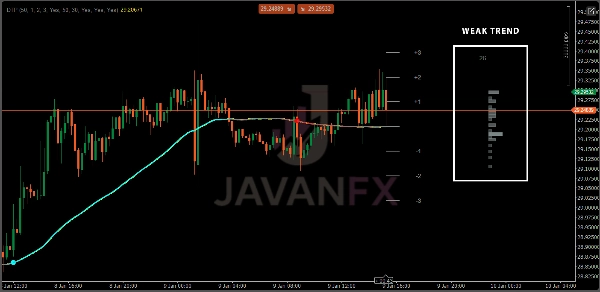
Wykrywanie trendu przez nachylenie SMA: Wykrywa zmiany trendu, gdy linia średniej ceny przesuwa się w górę lub w dół poza granicę 0,1, wychwytując zmiany momentum w czasie rzeczywistym.

Strefy odchylenia standardowego: Tworzy pasma cenowe ±1, ±2 i ±3 wokół średniej, wykorzystując ATR, budując elastyczne strefy dostosowujące się do zmienności rynku.

Profil rozkładu trendu: Tworzy poziomy wykres słupkowy pokazujący, jak często cena zamykała się w każdej strefie podczas bieżącego trendu, ujawniając miejsca, gdzie cena lubi się utrzymywać.

🔵 FUNKCJE

Sygnały trendu: Szybkie markery zmiany za pomocą kolorowych kółek przy odwróceniu trendu, ułatwiające zauważenie zmiany momentum.

Kolorowanie gradientu SMA: Linia średniej zmienia kolor w zależności od kierunku ruchu — od czerwonego (spadek) do cyjanu (wzrost) dla natychmiastowej informacji wizualnej.

Alerty dźwiękowe: Opcjonalne powiadomienia dźwiękowe przy rozpoczęciu nowych trendów wzrostowych lub spadkowych, aby nigdy nie przegapić ważnych zmian na rynku.

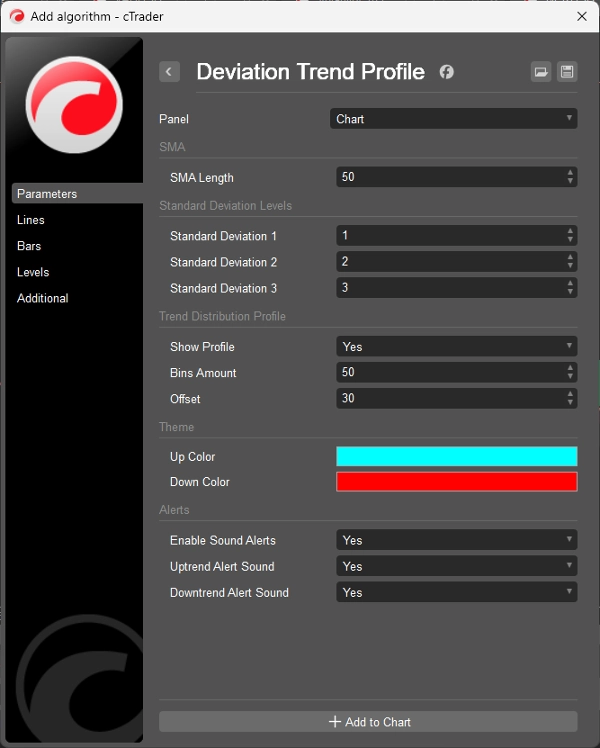
Łatwe dostosowanie: Zmieniaj długość średniej, rozmiary stref, słupki wykresu i kolory, aby dopasować do swojego stylu handlu.


⚠️ ZASTRZEŻENIE

Ten wskaźnik służy wyłącznie celom edukacyjnym i informacyjnym. Nie gwarantuje zysków ani nie przewiduje przyszłych ruchów cen. Handel wiąże się z istotnym ryzykiem strat, a wyniki historyczne nie wskazują na przyszłe rezultaty. Zawsze stosuj odpowiednie zarządzanie ryzykiem, przeprowadzaj własne analizy i nigdy nie handluj pieniędzmi, których nie możesz stracić. Twórca nie ponosi odpowiedzialności za jakiekolwiek straty handlowe wynikające z używania tego narzędzia.

Podsumowanie

Podsumowanie AI
Deviation Trend Profile is a technical indicator designed to track market trends by identifying price zones and movement patterns. It uses the slope of a Simple Moving Average (SMA) to detect trend changes when the average price line shifts beyond a set threshold, capturing momentum shifts in real time. The indicator constructs dynamic price bands at ±1, ±2, and ±3 standard deviations around the average price using the Average True Range (ATR), adapting to varying market volatility.

A sideways bar chart visualizes the distribution of closing prices within these zones during the current trend, highlighting price concentration areas. Key features include color-coded trend signals with circles that mark trend reversals, SMA line color changes reflecting trend direction (red for falling, cyan for rising), and optional audio alerts for new trend initiations. Users can customize parameters such as average length, zone sizes, chart bars, and colors to suit individual trading preferences.

This tool supports analysis across multiple markets including Forex, stocks, indices, commodities, and cryptocurrencies, and is applicable to various trading strategies like scalping and breakout trading. It provides visual and auditory cues to assist traders in monitoring trend shifts and price behavior within defined volatility zones.
Profil wskaźnika

Dyskusja

Opinie klientów

4.6
Opinie: 5
5
60 %
4
40 %
3
0 %
2
0 %
1
0 %
Opinie klientów
January 20, 2026
The noisy parts of the chart show up earlier, but impatience can still break the idea.
January 19, 2026
A quiet demo run gives a better read. It makes overtrading easier to notice.
January 19, 2026
January 16, 2026
A few ugly trades are useful in the sample, and market checks feel less scattered.
January 11, 2026
the useful bit is the journal looks less noisy. The chart still deserves a proper look.

Częste pytania
Prop
Forex
Signal
Breakout
Scalping
Indices
Commodities
Crypto
Stocks
AI
ATR
Produkty dostępne za pośrednictwem cTrader Store, w tym boty handlowe, wskaźniki i wtyczki, dostarczane są przez deweloperów zewnętrznych i udostępniane wyłącznie w celach informacyjnych oraz w celu zapewnienia dostępu technicznego. cTrader Store nie jest brokerem i nie zapewnia doradztwa inwestycyjnego, nie udziela spersonalizowanych rekomendacji ani nie gwarantuje przyszłych wyników.

Więcej od tego autora

Logo „UT Bot Alert”
Popularne
5.0
(5)
$19
Wskaźnik
ATR
Forex
+5
A powerful ATR-based indicator generating clear BUY/SELL signals. Features real-time alerts and customizable sensitivity
Wskaźnik
Alpha Sentiment Pro - See the Market's Pulse Before It Moves
Wskaźnik
ATR
Forex
+6
UT Bot Alerts Nova: Advanced trend-following indicator using ATR for signals. Precise entries/exits.
Wskaźnik
Parabolic SAR Alert - Trend reversal alerts with smart signals & custom alerts.
Wskaźnik
ZLSMA: Zero-lag trend indicator! Catch trends fast with customizable settings. Boost your trading precision.
Wskaźnik
Laser entries with pivot confirmation. No repaint, all timeframes. Professional results.
Logo „MA Sabres”
Popularne
4.2
(4)
$19
Wskaźnik
Conquer the markets with MA Sabres! This indicator spots trend flips with MAs and cool Sabre shapes & alerts.
Wskaźnik
Master RSI reversals with Parabolic SAR precision! Get real-time alerts for high-probability trend changes.
Wskaźnik
Spot Strong Trends Early & Filter Market Noise
Wskaźnik
AI
SMC
+9
Identifies market trends (-10 to +10) using HMA with volume confirmation. Includes customizable alerts.
Wskaźnik
BB Breakout Oscillator with alerts! Spot trend reversals using Bollinger Bands. Bullish/Bearish crossovers Alerts.
Wskaźnik
AI
RSI
+7
Multi-asset screener with real-time RSI/volatility analysis, interactive dashboard, and color-coded trading signals.

Możesz także polubić

Wskaźnik
Prop
Forex
+13
Unlock trading precision with QQE! Dual QQE indicators with a Bollinger Bands zero line provide clear buy/sell signals.
Wskaźnik
ATR
EMA
+3
The UTBot you know from TradingView — now on cTrader with confirmed signals, VWAP, EMA and session overlays.
Wskaźnik
Forex
EURUSD
+7
Institutional Session Levels Pro OHLC,Prev(D,W,M OHLC)
Wskaźnik
AI
Prop
+7
EMA Clouds, Multi-Timeframe (MTF) Overlay, Swing High/Low detection, and a smart Dashboard with neutral zone filtering.
Wskaźnik
Imbalance
Key Levels
+1
Keep open imbalance zones, untouched session highs and lows and the day's ADR range in view, without scrolling back.
Wskaźnik
Imbalance
Fair Value Gap
+1
Multi-symbol, multi-timeframe Fair Value Gaps in one panel.
Wskaźnik
[Hamster-Coder] Pivot Points (Multi Time Frame)
Wskaźnik
XAUUSD
Commodities
A Fair Value Gap (FVG) indicator that identifies potential price imbalances, potential reversal and continuation zones
Wskaźnik
Aggressive
Supertrend
+5
Stop trading with tunnel vision! 🚫 The Heat Map Dashboard is an institutional-grade visual trading assistant
Wskaźnik
Bollinger
Jurik Moving Average (Jurik's Moving Average) triple adaptive filter with unique Jurik smoothing and dynamic factor.
Wskaźnik
SMC
Prop
+12
Multi-TF FVG + Smart Fibonacci
Wskaźnik
AI
ATR
+26
MacD Custom Indicator-Multiple Time Frame
Wskaźnik
Forex
BTCUSD
+13
Sniper Zone Pro: High-precision institutional zones and candle strength for identifying key market tests.
Wskaźnik
Key Levels
Support & Resistance
Add your provider's gamma levels by hand or automatically with our feed plugin, and see the gamma regime at a glance.
Wskaźnik
ADX
ATR
+5
Configure, simulate, and analyze trading strategies with custom filters, multi-target exits, and detailed performance me
Wskaźnik
VWAP
Support & Resistance
Trading.FC$_vwap Algo shows VWAP trends, dynamic support/resistance and deviation bands to spot potential trade entries.
Wskaźnik
AI
ATR
+9
Index Hunter: Momentum analysis for US30 & NAS100. Designed to identify high-velocity moves and intraday trends.
Logo „AutoAVWAP”
Najwyżej oceniane
4.6
(5)
$19
/
$25
Wskaźnik
Prop
VWAP
+11
The best automatic anchored VWAP indicator every trader can get help from.

Cena

Od 14/07/2025
71
Sprzedaż