
Описание
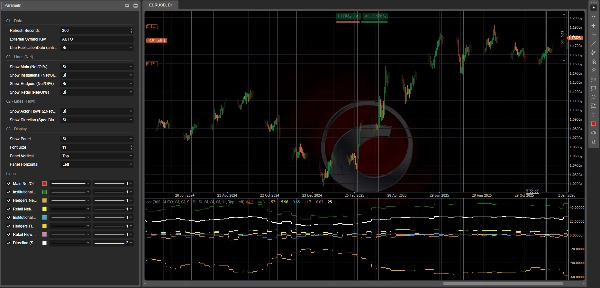
📊 Индикатор COT History Pro — Поток участников + Направление (Институциональные / Хеджеры / Розничные)
CotIndicatorHistoryPro выводит продвинутые данные Commitments of Traders (COT) прямо на ваш график с четким разделением по участникам рынка (Институциональные, Хеджеры/Коммерческие, Розничные).
Он показывает не только где расположен каждый участник (преимущественно лонг/шорт), но и что они делают прямо сейчас (увеличивают лонги или шорты), а также синтетическую линию Направления для выделения преобладающего уклона.
Индикатор загружает свой набор данных из защищенного JSON-фида (HISTORY + OUTPUT) и корректно выравнивает его на графике (опция анти-лучшего взгляда с использованием PublicationDate).
🗓️ Еженедельное обновление данных (пятница 21:00)
Набор данных COT обновляется каждую пятницу в 21:00 (по времени Европы/Рима) благодаря специализированному автоматизированному процессу:
сложный скрипт обработки выполняет расчеты и публикует обновленные значения в JSON-фид, используемый индикатором (и связанной экосистемой cBot, если установлена).
✅ Сам индикатор обновляется на платформе с использованием вашей настройки Refresh Seconds и отображает новые еженедельные данные сразу после их публикации.
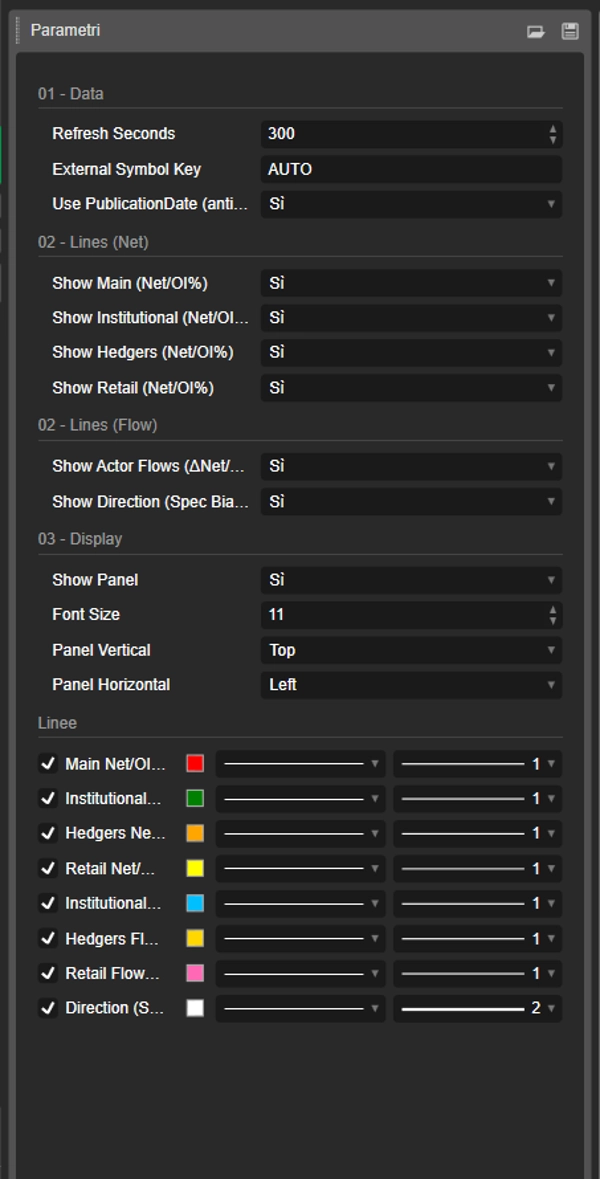
✅ Что вы получаете (линии + панель)
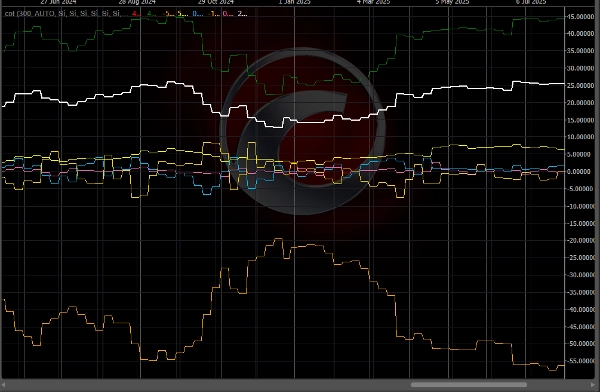
🔥 Линии “Потока” (3 участника) — ΔNet/OI%
Эти линии представляют изменение чистых позиций за неделю, нормализованное по открытому интересу:
- 🔵 Поток институциональных участников (ΔNet/OI%)
- 🟡 Поток хеджеров / коммерческих участников (ΔNet/OI%)
- 💗 Поток розничных участников (ΔNet/OI%)
📌 Как читать:
- Выше 0 ⇒ участник увеличивает чистый ЛОНГ (добавляет лонги и/или покрывает шорты)
- Ниже 0 ⇒ участник увеличивает чистый ШОРТ (добавляет шорты и/или сокращает лонги)
- Большие абсолютные значения (например, ±1.5%, ±3%) ⇒ более сильные и значимые изменения позиций
🧭 Линия “Направления” — Спекулятивный уклон Net/OI%
- ⚪ Направление (спекулятивный уклон) Net/OI% суммирует преобладающее “спекулятивное” направление (среднее по Институциональным + Розничным, с запасным вариантом при необходимости).
📌 Как читать:
- > 0 ⇒ Спекулятивный уклон В ЛОНГ
- < 0 ⇒ Спекулятивный уклон В ШОРТ
- ≈ 0 ⇒ ФЛЭТ / нейтральная фаза
🧩 Информационная панель (полный контекст)
Встроенная панель отображает:
- 📄 Дата отчета / Дата публикации
- 📌 Открытый интерес + WoW (изменение за неделю)
- 🎯 Текстовый сигнал (если доступен в OUTPUT)
- Для каждого участника:
-
- Уклон (преимущественно ЛОНГ / ШОРТ / ФЛЭТ) на основе Net
- Net/OI%
- Поток (ΔNet/OI%)
- WoW ΔLong / ΔShort / ΔNet для понимания как изменилась позиция
🧠 Как читать (просто и практично)
✅ Поток vs Уклон (ключевое отличие)
- Поток = что они делают сейчас (добавляют лонги или шорты)
- Уклон = как они расположены в целом (преимущественно лонг или шорт)
Пример:
- Институциональный уклон ЛОНГ + положительный поток ⇒ они продолжают наращивать лонги
- Институциональный уклон ЛОНГ + отрицательный поток ⇒ сокращение лонгов / возможная ротация
🚦 Типичные торговые сценарии
✅ Сценарий A — Подтверждение тренда
- Направление > 0
- Поток институциональных участников > 0
➡️ Давление лонгов стабильно: часто сигнал к продолжению.
✅ Сценарий B — Возможный разворот (умные деньги против розничных)
- Поток институциональных участников > 0, в то время как поток розничных < 0
➡️ Розничные продают/шортят, а институты покупают: возможное накопление.
(Обратное = возможное распределение)
✅ Сценарий C — Хеджеры как “сигнал тревоги”
- Хеджеры на экстремальных уровнях (Net/OI далеко от нейтрали) + сильный поток
➡️ Возможная зона избытка / агрессивное хеджирование (часто лучше как предупреждение, чем как прямой сигнал входа).
✅ Сценарий D — “Накопление” на рынке (риск прорыва)
- Сильный поток + рост открытого интереса WoW
➡️ Входят новые позиции: вероятность продолжительных движений часто увеличивается.
⚡ Рутинное чтение за 10 секунд
- Проверьте Направление: ЛОНГ (>0) или ШОРТ (<0)
- Проверьте Поток институциональных участников: подтверждает или расходится?
- Проверьте Поток розничных участников: подтверждает или действует наоборот?
- Проверьте Открытый интерес WoW: расширение или сокращение позиций?
✅ Поддерживаемые символы + ключевая легенда (ключи символов JSON)
Индикатор может анализировать любой инструмент, доступный в JSON-фиде (поле data[].symbol в OUTPUT).
Как выбрать правильный инструмент
- Внешний ключ символа = AUTO 👉 автоматически использует символ графика (и удаляет любой суффикс после “.”, например,
US2000.ecn→US2000). - Если ваш брокер использует другие имена символов 👉 установите Внешний ключ символа в точное значение ключа JSON (без учета регистра).
Текущие ключи в фиде (пример снимка: reportDate 2026-02-17, publicationDate 2026-02-20)
- Форекс:
AUDUSD,EURUSD,GBPUSD,USDMXN - Индексы:
US100,US2000,DOW30,VIX - Товары/Металлы/Сельское хозяйство:
BRENT,WTI,COPPER,CORN,WHEAT,XAU(Золото),XAG(Серебро) - Криптовалюты:
BTC,ETH
📌 Если вы не видите значения на графике:
- проверьте, что символ графика совпадает с ключом JSON
- установите Внешний ключ символа вручную (например,
ETH,US2000) - проверьте панель Дата отчета/публикации, чтобы убедиться, что загружен последний набор данных
⚙️ Примечания
- Поддерживает более безопасное выравнивание с использованием PublicationDate (анти-лучшего взгляда) ✅
- Линии и панель могут быть включены/выключены отдельно.
📌 Отказ от ответственности: информационный индикатор, не является финансовой рекомендацией. Данные COT еженедельные и должны рассматриваться в контексте тренда, ключевых уровней и волатильности.
Сводка
The indicator sources data from a secured JSON feed updated every Friday at 21:00 (Europe/Rome time) and aligns it on the chart using publication dates to prevent lookahead bias. Users can view flow lines for each actor, a direction line indicating overall market bias, and an info panel detailing report dates, open interest, net positions, and weekly changes.
It supports a wide range of instruments including Forex pairs (e.g., EURUSD, GBPUSD), indices (e.g., US100, DOW30), commodities (e.g., Brent, Gold), and cryptocurrencies (BTC, ETH). Symbol selection can be automatic or manually set to match feed keys.
Typical use cases include trend confirmation, spotting potential reversals by comparing smart money and retail flows, hedger activity alerts, and breakout risk assessment based on open interest changes. The indicator is informational and designed to complement other technical analysis tools.
Отзывы покупателей
5 | 50 % | |
4 | 50 % | |
3 | 0 % | |
2 | 0 % | |
1 | 0 % |


