
Описание
RiskLotSizer — это индикатор управления размером позиции и рисками на основе графика для cTrader, разработанный, чтобы помочь трейдерам быстро и наглядно рассчитать подходящий размер сделки.
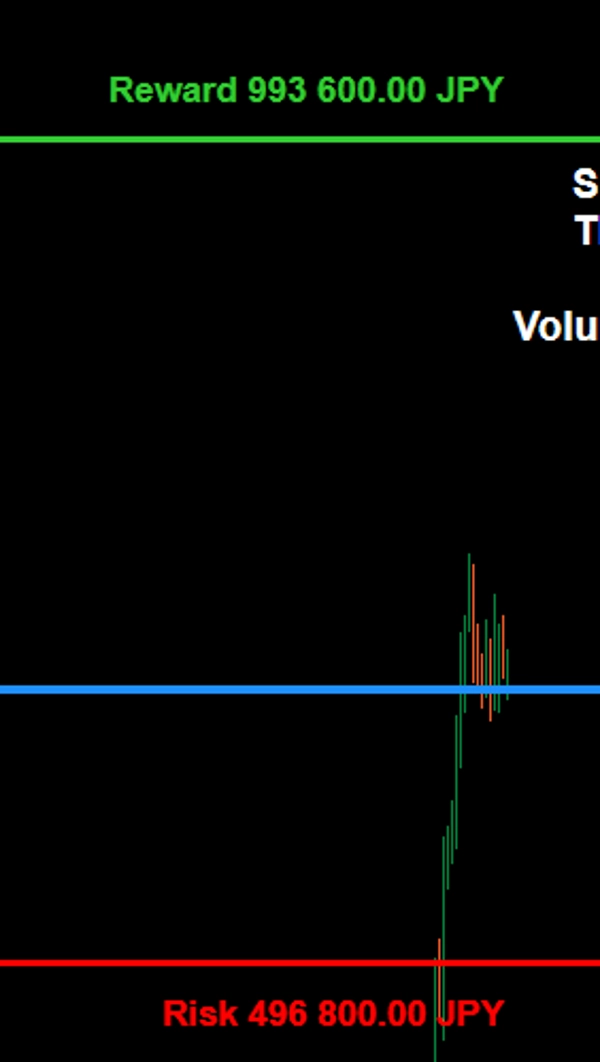
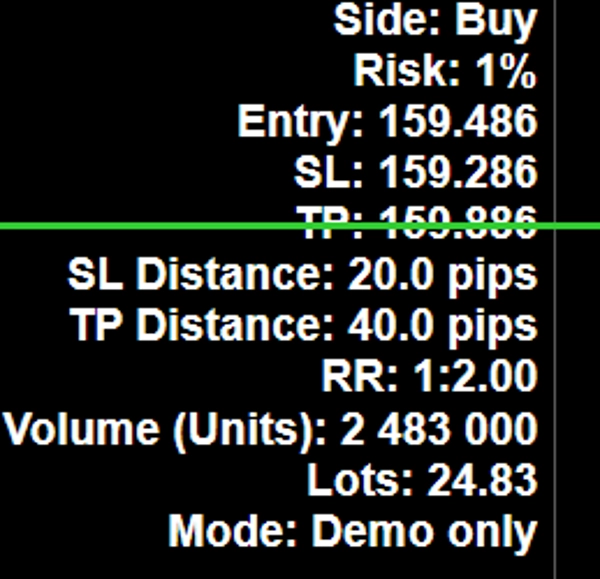
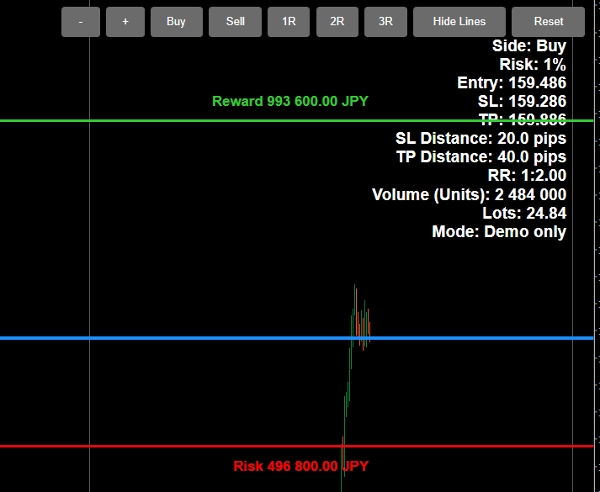
Индикатор позволяет настраивать уровни входа, стоп-лосса и тейк-профита непосредственно на графике, что облегчает планирование сделок в реальном времени. Исходя из выбранного вами процента риска от капитала счета, RiskLotSizer автоматически рассчитывает размер позиции и отображает предполагаемый размер лота, сумму риска, сумму вознаграждения и соотношение риск/вознаграждение.
Он поддерживает как сценарии покупки, так и продажи, и предназначен для того, чтобы дать трейдерам чёткое визуальное представление о риске сделки перед входом в позицию. Значения риска и вознаграждения отображаются непосредственно рядом с линиями SL и TP, а основная информационная панель предоставляет чистое резюме настройки.
Основные функции включают:
- Расчёт размера лота на основе выбранного процента капитала
- Регулируемые линии входа, SL и TP непосредственно на графике
- Отображение в реальном времени размера позиции, суммы риска, суммы вознаграждения и RR
- Поддержка режимов покупки и продажи
- Кнопки быстрого выбора RR для более быстрого планирования сделок
- Поддержка английского и японского языков
- Переключение видимости линий для более чистого графика при необходимости
RiskLotSizer идеально подходит для трейдеров, принимающих решения самостоятельно, дневных трейдеров и всех, кто хочет быстрее и яснее определять размер позиций, сохраняя при этом постоянный контроль риска.
RiskLotSizer は、チャート上で直感的にポジションサイズを計算できる cTrader 用のポジションサイジング・リスク管理インジケーターです。
Entry、Stop Loss、Take Profit の各ラインをチャート上で直接動かしながら、指定した有効証拠金比率に基づく適正ロット数を自動計算します。これにより、トレード前に必要なロット数、想定損失額、想定利益額、Risk/Reward をリアルタイムで把握できます。
Buy / Sell の両方に対応しており、RR プリセットボタンによって利確目標の調整も素早く行えます。また、SL・TP 付近には損失額・利益額が表示されるため、視覚的にも分かりやすく、実践的なトレード設計をサポートします。
主な特長:
- 有効証拠金に対する指定リスク率からロット数を自動計算
- Entry / SL / TP をチャート上で直接調整可能
- ロット数、損失額、利益額、RR をリアルタイム表示
- Buy / Sell の両方に対応
- RR プリセットボタン搭載
- 英語 / 日本語切替対応
- 必要に応じてライン表示の ON / OFF が可能
RiskLotSizer は、裁量トレーダー、デイトレーダー、そして一貫したリスク管理を重視するトレーダーに適したインジケーターです。
Сводка
Отзывы покупателей
5 | 0 % | |
4 | 100 % | |
3 | 0 % | |
2 | 0 % | |
1 | 0 % |