Описание
Hurst Cycle Channel Oscillator Advanced — Описание индикатора
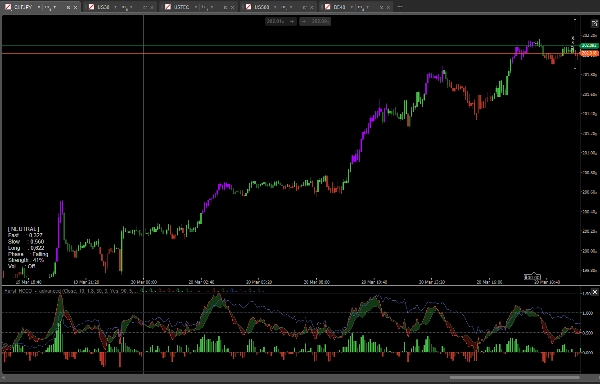
Hurst Cycle Channel Oscillator Advanced — это профессиональный мультицикловый индикатор импульса для cTrader, основанный на принципах теории циклов Херста. Вместо измерения сырого ценового импульса он позиционирует текущую цену внутри динамически рассчитанных циклических каналов, предоставляя трейдерам нормализованный взгляд на положение цены в её естественном циклическом движении.
Три слоя циклов
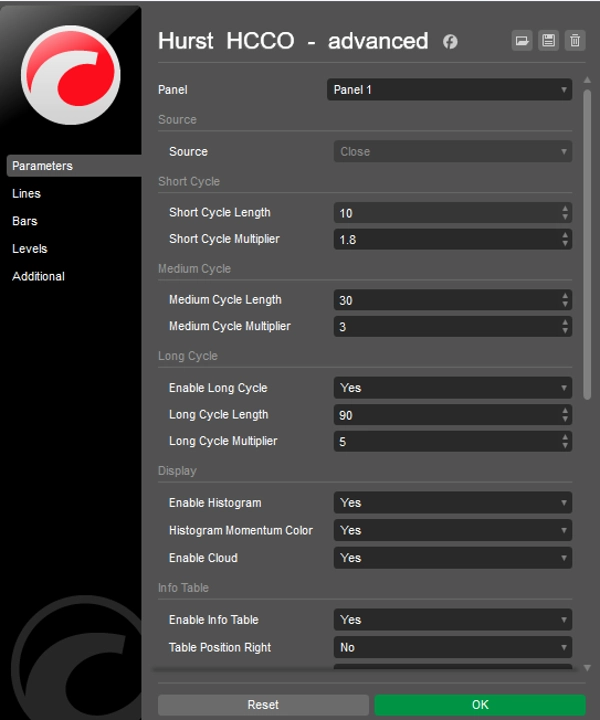
Индикатор рассчитывает три независимых циклических канала — Короткий, Средний и Длинный — каждый построен на основе экспоненциальной скользящей средней, центрированной внутри конверта на основе ATR. Короткий и Средний циклы управляют основным осциллятором, в то время как опциональный Длинный цикл предоставляет более широкий рыночный контекст. Все длины циклов и их множители ATR полностью настраиваемы.
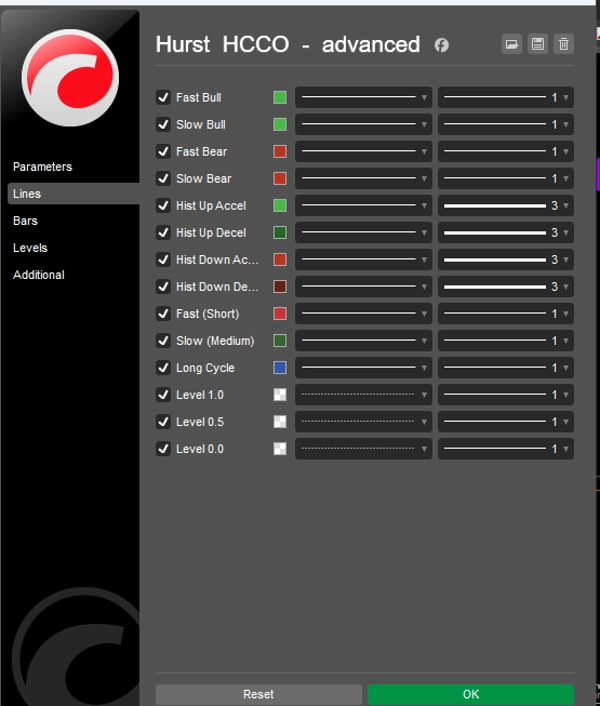
Быстрая и Медленная линии осциллятора
Быстрая линия показывает, где текущая цена находится внутри канала Среднего цикла — значение выше 0.5 означает, что цена в верхней половине своего цикла, ниже 0.5 — в нижней половине. Медленная линия представляет собой среднюю точку канала Короткого цикла относительно Среднего, выступая в роли сглаженного ориентира. Вместе они создают двухлинейный осциллятор, похожий по структуре на MACD, но основанный на геометрии циклов.
Циклическое облако
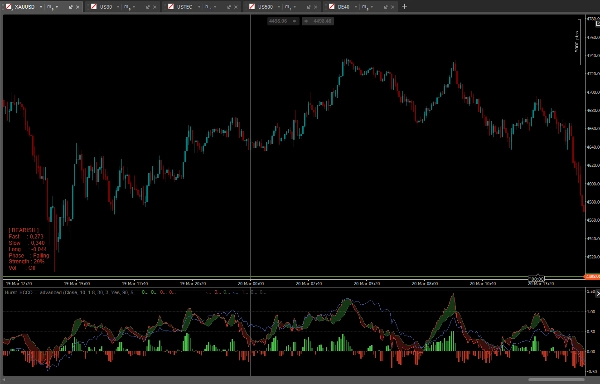
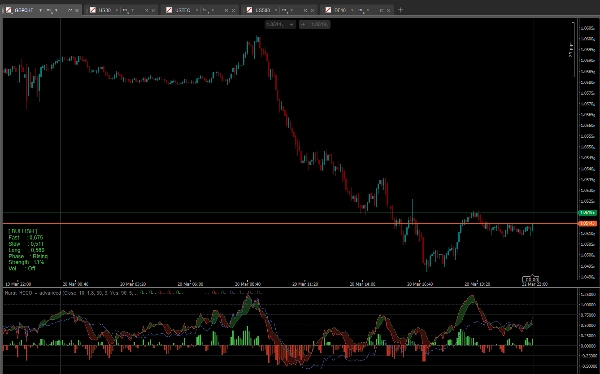
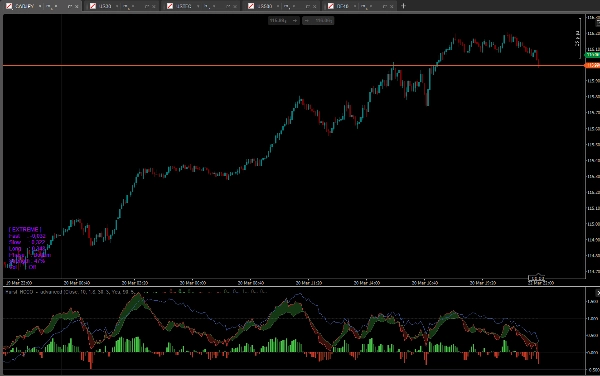
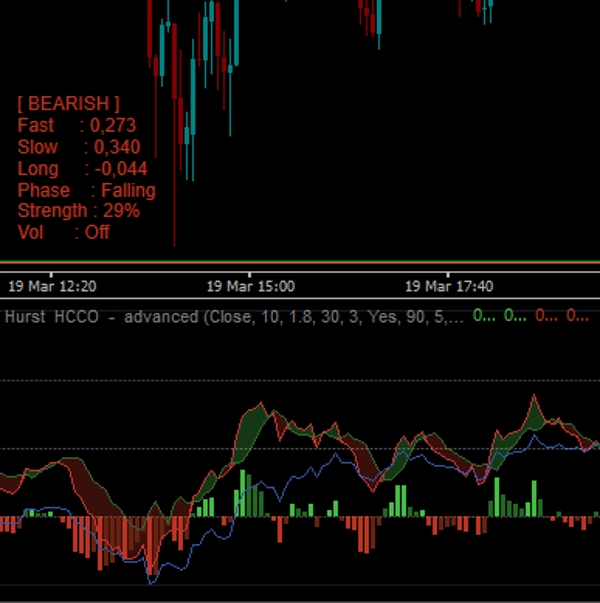
Опциональное облако заполняет область между Быстрой и Медленной линиями. Зелёное облако формируется, когда Быстрая линия выше Медленной (бычий циклический уклон), красное — когда Быстрая ниже Медленной (медвежий циклический уклон). Облако делает взаимосвязь между двумя слоями циклов мгновенно читаемой.
Гистограмма импульса
Гистограмма отображает разницу между Быстрой и Медленной линиями с четырёхцветным кодированием импульса — ускоряющийся бычий, замедляющийся бычий, ускоряющийся медвежий, замедляющийся медвежий. Это облегчает понимание не только направления, но и того, набирает ли циклическое движение энергию или теряет её.
Определение фазы цикла
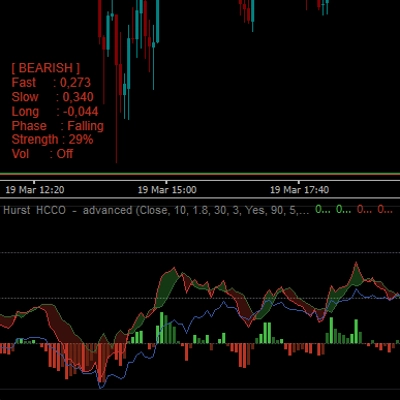
Информационная таблица отображает текущую фазу цикла: Дно, Преддно, Восстановление, Рост, Ослабление, После пика, Пик. Эта маркировка напрямую выводится из значения Быстрого осциллятора и его направления, предоставляя трейдерам понятное описание положения рынка в цикле.
Сила тренда
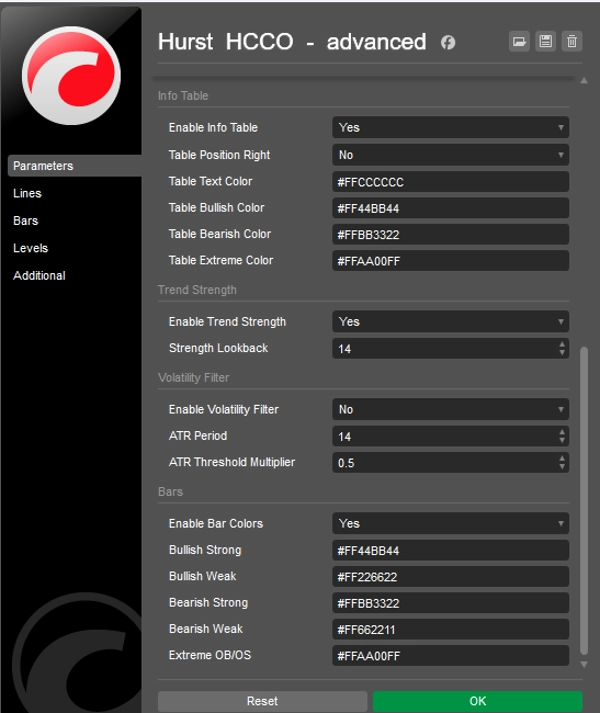
Настраиваемый период обратного просмотра вычисляет нормализованный показатель силы тренда на основе того, насколько далеко Быстрая линия отклоняется от средней точки 0.5. Результат отображается в процентах в информационной таблице.
Фильтр волатильности
Опциональный фильтр волатильности на основе ATR затемняет бары гистограммы и их цвета, когда рыночная волатильность опускается ниже настраиваемого порога, предотвращая генерацию осциллятором вводящих в заблуждение сигналов в условиях флэта или нерегулярного движения.
Информационная таблица
Компактная таблица на графике показывает текущее состояние рынка (Бычий, Медвежий, Нейтральный, Экстремальный), значения Быстрого, Медленного и Длинного осцилляторов, фазу цикла, процент силы тренда и статус фильтра волатильности. Положение и все цвета настраиваемы.
Окраска баров
При включении свечи графика окрашиваются в зависимости от состояния осциллятора — сильный бычий, слабый бычий, слабый медвежий, сильный медвежий и экстремальные зоны перекупленности/перепроданности. Экстремальные значения возникают, когда Быстрая линия выходит за пределы диапазона 0.0–1.0, сигнализируя о прорыве цены за пределы циклического канала.
Краткое описание ключевых особенностей
- Три настраиваемых слоя циклов на основе теории циклов Херста
- Двойной Быстрый/Медленный осциллятор, нормализованный по положению в циклическом канале
- Циклическое облако между Быстрой и Медленной линиями
- Четырёхцветная гистограмма импульса
- Автоматическое определение фазы цикла с понятными метками
- Процент силы тренда в реальном времени
- Фильтр волатильности на основе ATR
- Информационная таблица на графике с полным разбором состояния рынка
- Опциональная окраска свечей
- Все цвета полностью настраиваемы с поддержкой альфа-канала
- Без перерисовки
Сводка
Отзывы покупателей
5 | 100 % | |
4 | 0 % | |
3 | 0 % | |
2 | 0 % | |
1 | 0 % |


