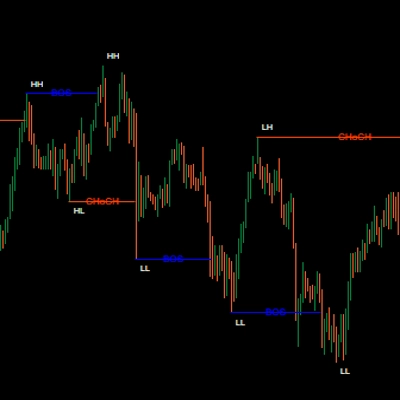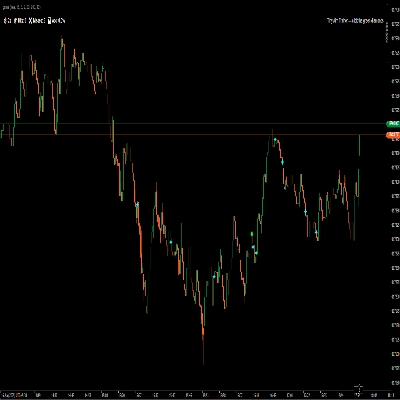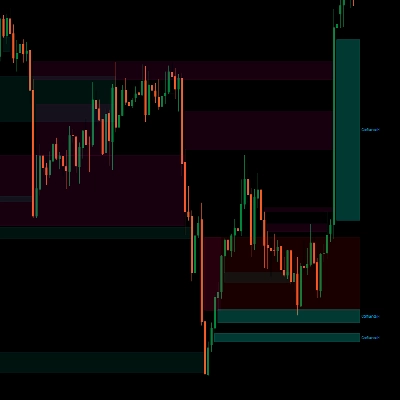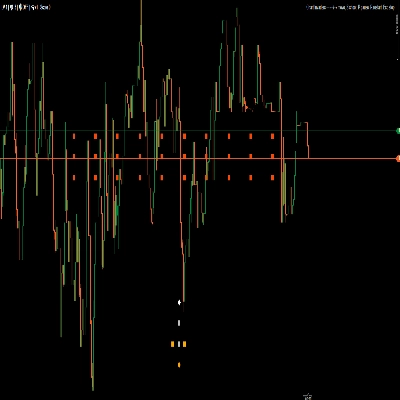
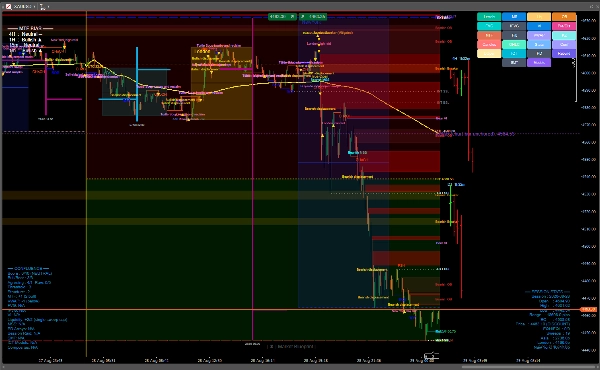
Description
Market Blueprint
Market Blueprint helps you identify these areas before price reaches them, allowing you to approach
the market with a structured plan instead of reacting emotionally.
"Your Entire Trading Framework In One Place"
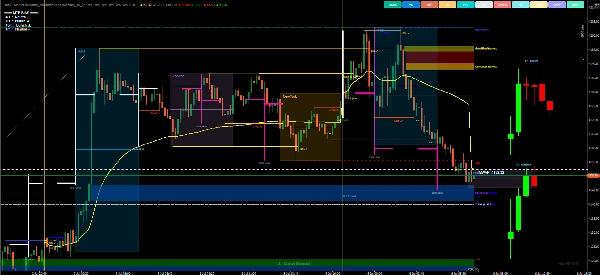
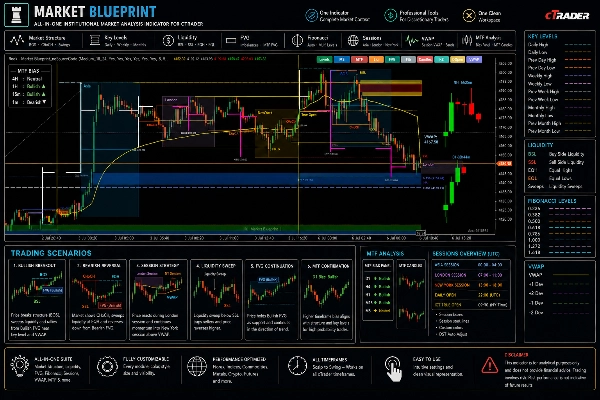
Transform your chart into a complete market analysis workspace with a single professional indicator.
One Indicator. Eleven Core Modules. Infinite Possibilities
Features
Market Blueprint integrates:
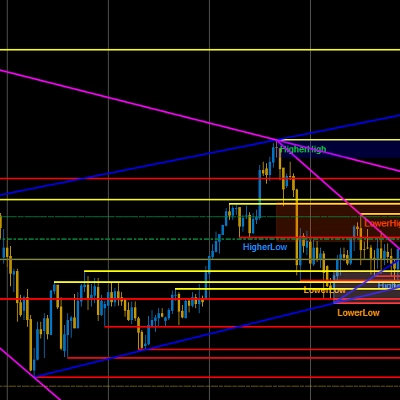
✓ Market Structure
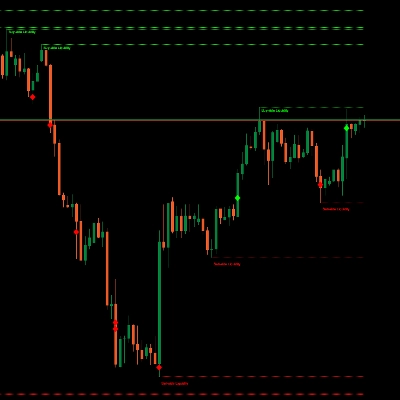
✓ Liquidity Analysis
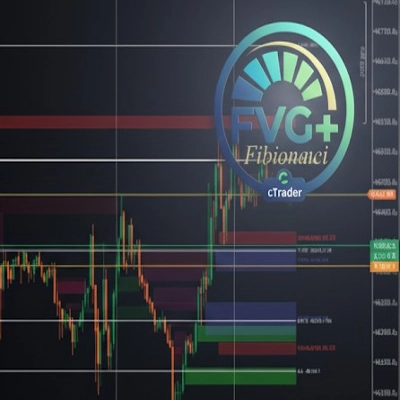
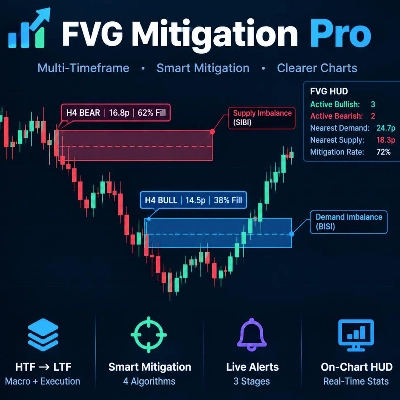
✓ Fair Value Gaps
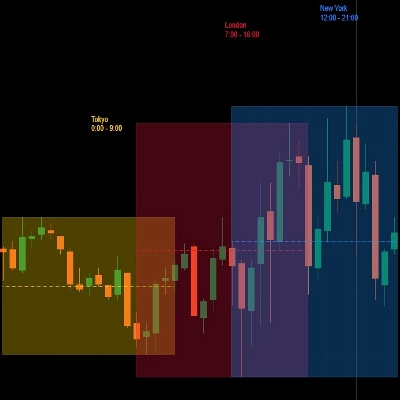
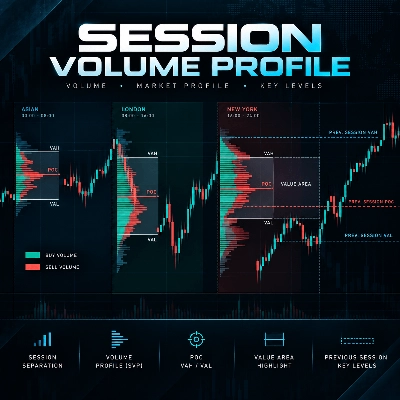
✓ Session Frameworks
✓ Multi-Timeframe OHLC
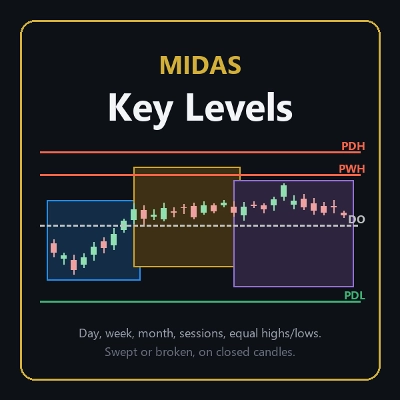
✓ Key Levels
✓ Fibonacci
✓ VWAP
✓ Higher Timeframe Bias
All controlled through a clean and intuitive interface.
Use Cases
Market Blueprint can be used to:
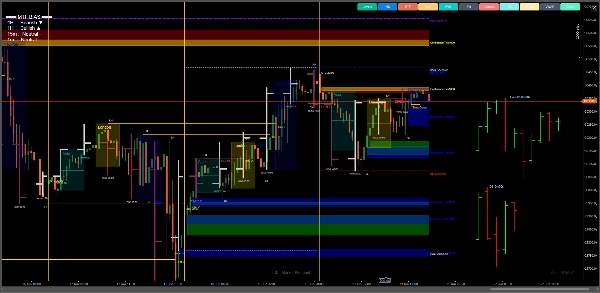
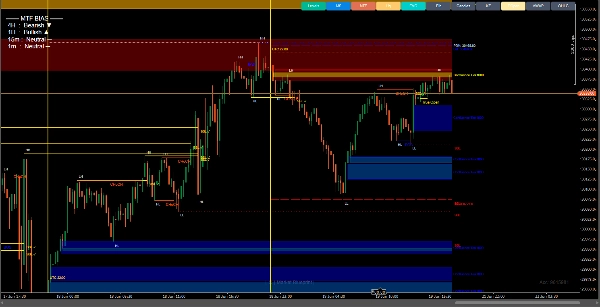
- Analyse market structure and trend changes
- Identify important support and resistance areas
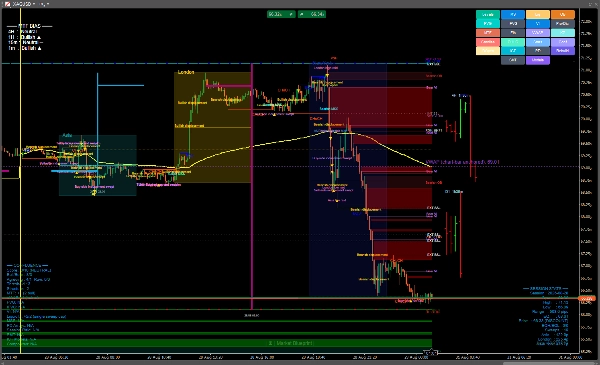
- Monitor liquidity pools and liquidity sweeps
- Locate Fair Value Gaps
- Display automatic Fibonacci retracements
- Monitor higher timeframe market bias
- Visualise major trading sessions
- Track Session VWAP
- View higher timeframe candles without changing charts
Perfect For
✓ Price Action Traders✓ Smart Money Traders ✓ ICT Traders
✓ Scalping Traders ✓ Intraday Traders ✓ Swing Traders
✓ Prop Firm Traders ✓ Professional Traders
Adaptive Interface, Theme-Aware, Performance Optimized
Instant Toggle System
Every module includes a dedicated ON/OFF button.
Notes
- Historical calculations depend on available broker history.
- Market Structure is confirmed after the configured confirmation rule.
- Price levels may vary slightly between brokers due to different data feeds.
How to Use
- Add Market Blueprint to your chart.
- Use the top toggle bar to enable only the modules you need.
- Start with Higher Timeframe Bias and Key Levels.
- Identify liquidity targets and market structure shifts.
- Use Fair Value Gaps and Fibonacci levels for entry zones.
- Align trades with session activity and higher timeframe context.
- Manage trades using structure, liquidity, and key level reactions.
Recommended Workflow:
HTF Bias → Key Levels → Liquidity → Structure Shift → LTF Alignment → FVG, Fibonacci confluence Entry → Trade Management
- Asset Support: Forex, Indices, Metals, Crypto, Commodities
- Multi-Timeframe Analysis: Supported
Disclaimer:
Market Blueprint is an analytical tool and does not provide financial, investment, or trading advice.
Trading leveraged financial products involves substantial risk and may not be suitable for all investors. Past performance does not guarantee future results. Users are solely responsible for their trading decisions, risk management, and compliance with applicable regulations.
Summary
The interface is clean and intuitive, featuring an instant toggle system that allows users to enable or disable individual modules as needed. Market Blueprint supports analysis across various asset classes such as Forex, Indices, Metals, Crypto, and Commodities. It is suitable for multiple trading styles including price action, liquidity, smart money, intraday, swing, multi-timeframe, prop firm, and professional trading.
Recommended workflow involves starting with higher timeframe bias and key levels, followed by liquidity and structure shifts, then aligning lower timeframe entries with FVG and Fibonacci confluences, and managing trades based on structure and liquidity reactions. The tool is performance optimized and theme-aware, designed to transform a chart into a complete market analysis workspace. It provides visualizations and filters based on bar and tick data but does not execute trades or provide financial advice.
Discussion
Customer reviews
5 | 100 % | |
4 | 0 % | |
3 | 0 % | |
2 | 0 % | |
1 | 0 % |