

Описание
Промо-цена: $697 Воспользуйтесь шансом. Цена возвращается к $897 после определённого количества скачанных копий APEX .
APEX MARKET STRUCTURE PRO (версия для агентов)
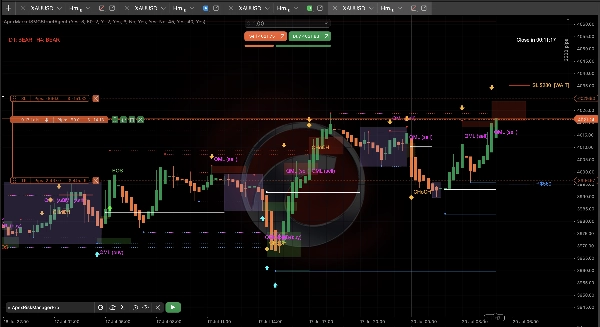
Точный оверлей структуры рынка для cTrader, который отображает механику цены, ликвидности, сдвигов структуры и сжатия на одном чистом, не перерисовывающемся графике. Профессиональная версия дополнительно предоставляет каждое структурное чтение в виде данных, читаемых машиной, для алгоритмической и агентской интеграции через API cAlgo.
Только индикатор: он рисует структуру и предоставляет её как данные, читаемые машиной.
Сам индикатор никогда не размещает ордера. Его выходные данные могут питать внешнюю автоматизированную систему или агента (Claude через MCP или любой клиент cAlgo API), который выполняет операции независимо через собственное торговое подключение. Обратите внимание, что исполнение — ответственность оператора, а не индикатора.
ЧТО АНАЛИЗИРУЕТ
Apex Market Structure Pro читает необработанное ценовое движение на любом инструменте и любом таймфрейме. Он определяет:
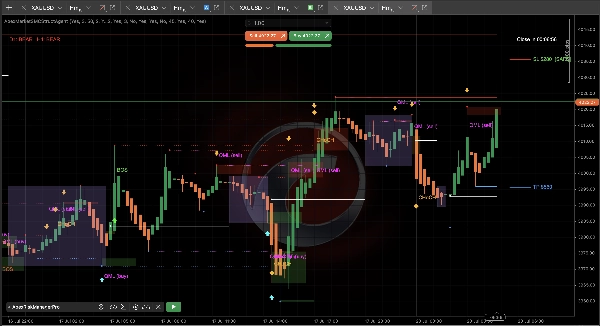
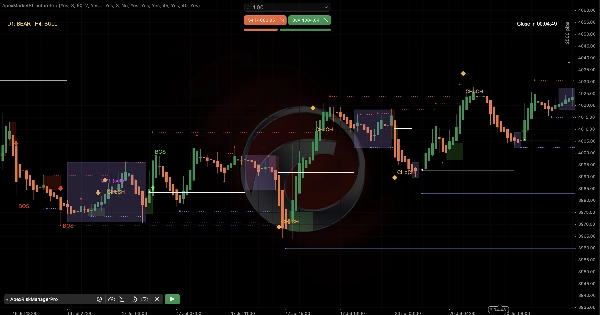
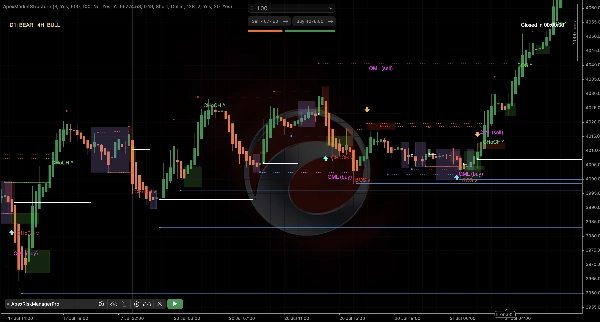
- Уровни ликвидности: максимумы и минимумы колебаний, которые служат стоп-пулами. Непробитые уровни проецируются вперёд; пробитые уровни замораживаются и становятся пунктирными, обозначая израсходованную ликвидность.
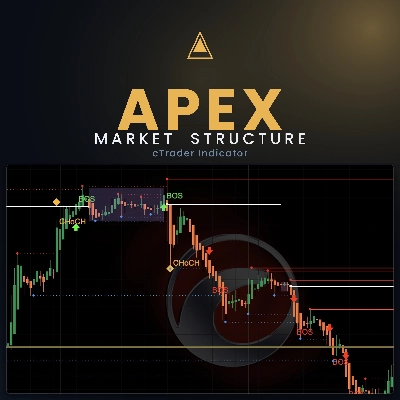
- Структура рынка: Пробой структуры (BOS, продолжение) и Изменение характера (CHoCH, разворот), каждое подтверждается только закрытием бара.
- Зоны сжатия: заполненные зоны, обозначающие сжатие волатильности (накопление) через тест отношения ATR, с линией значения средней цены.
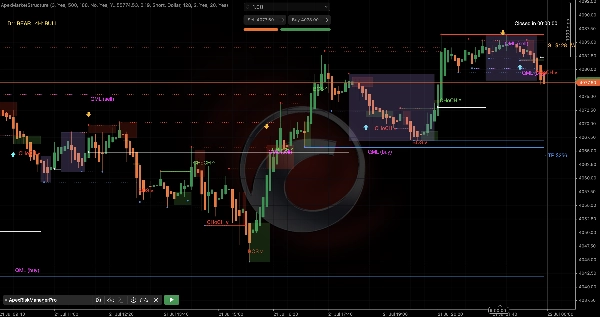
- Смещение старшего таймфрейма: дневной и 4-часовой тренд EMA, считываемый с последнего закрытого бара HTF (без заглядывания вперёд, без внутридневной перерисовки).
- Индикатор риска перед входом: визуальный инструмент для установки SL/TP, который оценивает ваш стоп относительно ближайшей непроработанной ликвидности: БЕЗОПАСНО (стоп за уровнем) или ЖДАТЬ (стоп перед уровнем).
НЕ ПЕРЕРИСОВЫВАЕТСЯ ПО ДИЗАЙНУ
Каждый постоянный объект: линия ликвидности, свип, метка BOS/CHoCH, стрелка входа, зона сжатия, линия значения создаётся только из ЗАКРЫТОГО бара, никогда из формирующейся свечи. График идентичен при построении в реальном времени по тикам или при перерасчёте при перезагрузке. Сигналы появляются на один бар позже закрытия свечи, которая их породила — это сознательная плата за отсутствие перерисовки.
КАК ЧИТАТЬ
- Линии ликвидности (красный = сторона продаж/максимумы, синий = сторона покупок/минимумы) показывают, где расположены стопы. Пробой непроработанного уровня часто предшествует развороту.
- BOS подтверждает продолжение тренда; CHoCH предупреждает о возможном развороте.
- Зоны сжатия обозначают компрессию, а расширение обычно следует за ними.
- Панель смещения HTF (вверху слева) показывает согласование дневного и 4-часового таймфреймов. Торгуйте в направлении дневного тренда; используйте младшие таймфреймы для тайминга.
- Индикатор риска (справа) — это гипотетическая проверка перед входом. Устанавливайте стоп так, чтобы он проходил ближайшую ликвидность перед входом.
PRO — ВЫХОДНЫЕ ДАННЫЕ, ЧИТАЕМЫЕ МАШИНОЙ
Для алгоритмических трейдеров и кастомной автоматизации профессиональная версия публикует своё структурное состояние в виде серий данных, читаемых через API cAlgo: смещение HTF, фаза рынка, коэффициент сжатия ATR, ближайшие непроработанные уровни ликвидности, события BOS/CHoCH и вердикт риска. Эти выходные данные прозрачны (график остаётся визуально чистым) и не перерисовываются на закрытых барах. Подходят для создания собственных инструментов поддержки принятия решений и интеграций агентов поверх структуры Apex.
КЛЮЧЕВЫЕ НАСТРОЙКИ
- Ликвидность — сила колебаний, макс. количество линий, толщина
- Структура — сила малых/больших колебаний (большие определяют защищённые уровни, пробой которых — CHoCH), макс. количество меток
- Сжатие — период ATR, коэффициент сжатия, мин. бары, непрозрачность зоны
- Смещение HTF — период EMA; стрелки входа опционально фильтруются по смещению (D1 / H4 / оба)
- Индикатор риска — баланс, размер лота, направление (Long/Short/Auto), режим риска (процент или доллар), соотношение прибыль:риск
- Оповещения — новая зона, свип ликвидности, BOS/CHoCH, стрелка входа (все опционально, срабатывают только на живых закрытых барах)
- Агент: включение или отключение выходных данных, читаемых машиной. При включении внешний агент (через API cAlgo) может считывать структурное состояние индикатора для сверки с вашим анализом. Переключатель контролирует только раскрытие данных; любое исполнение сделок выполняется внешней системой через собственное подключение по усмотрению оператора.
ЛУЧШЕ ВСЕГО ПОДХОДИТ ДЛЯ
Дискреционных и алгоритмических трейдеров, которые торгуют с использованием структуры рынка и концепций умных денег — чтение ликвидности, пробоев структуры и контекста старших таймфреймов. Визуальный слой служит для мануальных трейдеров любого уровня опыта, желающих получить чистое структурное чтение; выходные данные служат разработчикам, создающим автоматизацию на платформе cAlgo. Работает на всех инструментах и таймфреймах; полный рабочий процесс лучше всего ощущается на свечах Heikin Ashi.
ОГРАНИЧЕНИЯ И ЗАМЕЧАНИЯ
- Это индикатор — он анализирует и отображает; не исполняет сделки и не даёт финансовых советов.
- Сигналы подтверждаются на закрытых барах, появляются на один бар позже свечи, которая их породила — по дизайну, чтобы гарантировать отсутствие перерисовки.
- Индикатор риска — это визуальная помощь в определении размера, а не ордер.
- Выходные данные, читаемые машиной, считываются через API cAlgo; интеграция их в автоматизированную систему — ответственность разработчика.
Сводка
The indicator provides a pre-entry risk gauge that visually assesses stop-loss placement relative to the nearest unswept liquidity level, indicating whether the stop is "SAFE" or requires "WAIT." It supports customization of liquidity detection, structure sensitivity, contraction parameters, EMA periods, risk sizing, and alert preferences.
The Pro edition uniquely exposes all structural readings as machine-readable data outputs accessible via the cAlgo API. This enables integration with external algorithmic trading systems or agents, which can independently execute trades based on the indicator’s data. The indicator itself does not place orders.
Apex Market Structure Pro is suitable for discretionary and algorithmic traders employing market structure and smart-money concepts across all instruments and timeframes. It is optimized for use with Heikin Ashi candles and supports building custom decision-support tools or automated strategies on the cAlgo platform.
Отзывы покупателей
Обсуждение
Частые вопросы
Больше от этого автора
Вам также может понравиться

Цена
