

Описание
## 📊 Что такое пробои уровней поддержки и сопротивления?
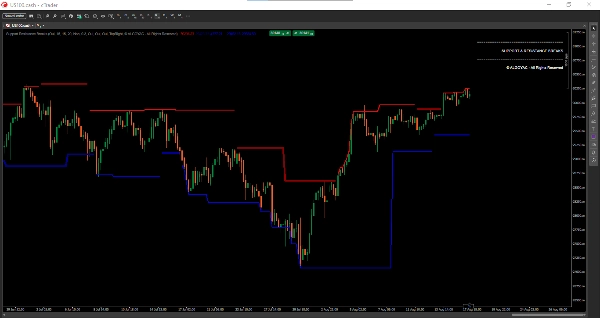
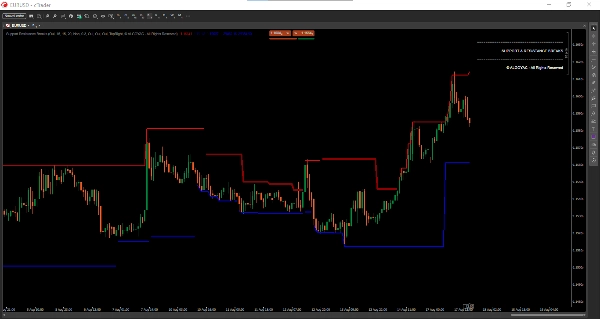
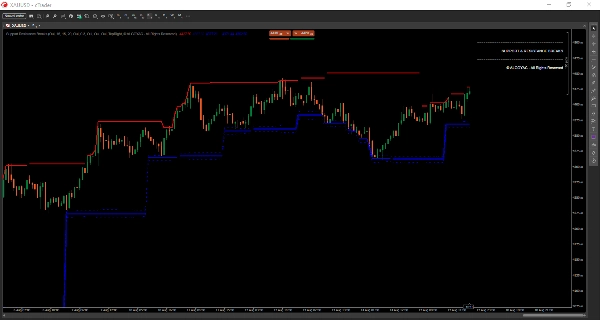
Support & Resistance Breaks — это индикатор профессионального уровня, который в реальном времени определяет ключевые ценовые уровни и оповещает трейдеров о высоковероятных возможностях пробоя. В отличие от традиционных индикаторов с запаздыванием, этот инструмент обнаруживает зоны поддержки и сопротивления по мере их формирования, позволяя трейдерам быстро реагировать на рыночные движения.
Индикатор сочетает анализ pivot points с подтверждением объёмом и сложной системой оценки, чтобы выделять только самые значимые уровни.
## 🎯 Основные функции
### 1. Обнаружение уровней в реальном времени
- **Без запаздывания** : уровни определяются по мере их формирования, а не задним числом
- **Динамические обновления** : поддержка и сопротивление адаптируются к изменяющимся рыночным условиям
- **Автоматическая корректировка** : уровни обновляются на основе ценового действия
### 2. Оценка силы уровней
Каждому уровню присваивается оценка силы (0-100%) на основе:
- **Количество касаний** (40%) : сколько раз цена тестировала уровень
- **Объём на уровне** (30%) : торговая активность рядом с уровнем
- **Отторжение свечей** (20%) : качество отскоков цены
- **Свежесть уровня** (10%) : насколько недавно уровень был сформирован
Сильные уровни (>60%) отображаются более толстыми линиями:
- **Тёмно-красный/синий** : сильные уровни (высокая вероятность)
- **Светло-красный/синий** : стандартные уровни (умеренная вероятность)
### 3. Зоны поддержки/сопротивления
- **Настраиваемый размер зоны** : основан на множителе ATR
- **Визуальные зоны** : пунктирные линии, показывающие полную ширину зоны
- **Реалистичное отображение** : зоны лучше отражают реальное поведение рынка, чем одиночные линии
### 4. Оценка качества пробоя
Каждый сигнал пробоя включает оценку качества (0-100%) на основе:
- **Подтверждение объёмом** (30%) : всплеск объёма во время пробоя
- **Размер тела свечи** (25%) : сила свечи пробоя
- **Позиция закрытия** (25%) : где цена закрылась относительно диапазона
- **Сила уровня** (20%) : важность пробитого уровня
**Цвета качества :**
- **Лайм** : высококачественный пробой (>70%)
- **Жёлтый** : среднее качество (40-70%)
- **Оранжевый** : низкое качество (<40%)
### 5. Сигналы пробоя
- **Метка "B"** : пробой с подтверждением объёмом
- **"Bull Wick"** : бычье отторжение поддержки
- **"Bear Wick"** : медвежье отторжение сопротивления
## 📈 Как интерпретировать сигналы
### Подтверждение пробоя
Высококачественный пробой (метка "B" лаймового цвета) с сильным объёмом указывает на настоящий пробой. Низкокачественные пробои (оранжевые) могут быть ложными сигналами.
### Тестирование уровней
Когда цена многократно тестирует уровень (много касаний), уровень укрепляется. Сильные уровни с большей вероятностью удержатся или вызовут значительные развороты.
### Торговля в зонах
Вместо торговли по точным уровням используйте зоны. Входите около границ зоны, а не в середине.
### Анализ объёма
Осциллятор объёма (EMA 5 против EMA 10) помогает подтвердить достоверность пробоя. Пробои с объёмом > порога более надёжны.
## ⚙️ Настройки и параметры
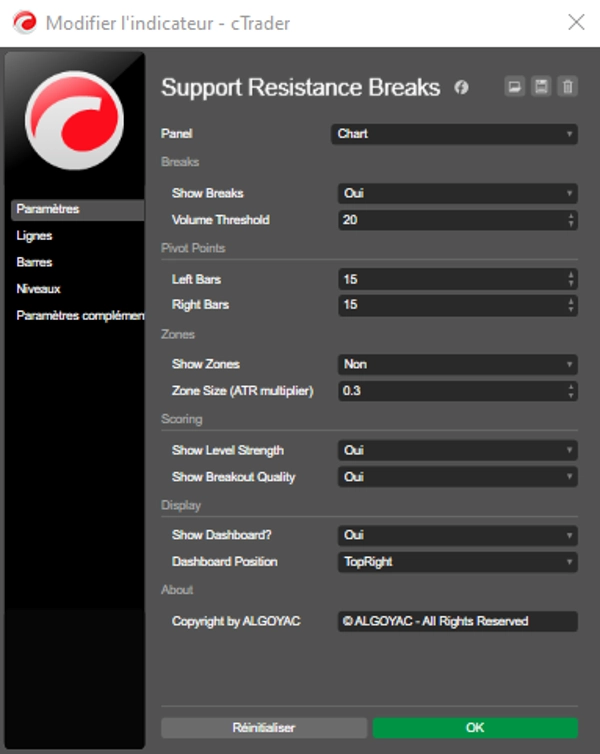
### Группа Pivot Points
- **Левые бары** (по умолчанию: 15) : количество баров слева для определения pivot
- **Правые бары** (по умолчанию: 15) : количество баров справа для подтверждения pivot
### Группа Breaks
- **Показывать пробои** (по умолчанию: true) : отображать сигналы пробоя
- **Порог объёма** (по умолчанию: 20) : минимальное значение осциллятора объёма для валидных пробоев
### Группа Zones
- **Показывать зоны** (по умолчанию: true) : отображать зоны поддержки/сопротивления
- **Размер зоны** (по умолчанию: 0.3) : ширина зоны как множитель ATR
### Группа Scoring
- **Показывать силу уровней** (по умолчанию: true) : отображать сильные и слабые уровни
- **Показывать качество пробоя** (по умолчанию: true) : отображать оценки качества пробоев
## 💼 Типичные случаи использования
### Дневная торговля
- Используйте на таймфреймах M15-H1
- Входите на высококачественных пробоях (метки лаймового цвета)
- Устанавливайте стопы за границами зоны
- Фиксируйте прибыль на следующем уровне поддержки/сопротивления
### Свинг-трейдинг
- Используйте на таймфреймах H4-D1
- Сосредоточьтесь на сильных уровнях (>60% силы)
- Ждите, пока цена достигнет зон перед входом
- Используйте качество пробоя для подтверждения
### Скальпинг
- Используйте на таймфреймах M1-M5
- Торгуйте отскоки от сильных уровней
- Быстрые входы/выходы на границах зон
- Подтверждение объёмом обязательно
## 👥 Для кого этот индикатор?
### Подходит для:
- **Трейдеров уровней** : определять и торговать ключевые уровни
- **Трейдеров пробоев** : ловить настоящие пробои с подтверждением качества
- **Трейдеров диапазона** : торговать между зонами поддержки и сопротивления
- **Трейдеров объёма** : использовать анализ объёма для подтверждения
### Уровень опыта:
- **Новички** : чёткие визуальные уровни и сигналы
- **Средний уровень** : использовать оценки для лучших входов
- **Продвинутые** : сочетать с анализом на нескольких таймфреймах
## ⚠️ Важные заметки и ограничения
1. **Ложные пробои** : не все пробои успешны. Используйте оценки качества и подтверждение объёмом.
2. **Избыточность уровней** : слишком много уровней на волатильных рынках. Настраивайте Left/Right Bars соответственно.
3. **Ширина зон** : зоны могут быть широкими на рынках с высоким ATR. Настраивайте параметр Zone Size.
4. **Не автономный** : лучше использовать вместе с другими индикаторами (моментум, трендовый анализ).
5. **Рыночные условия** : лучше работает на трендовых рынках. На рынках в боковом движении может давать много ложных сигналов.
## 🔧 Рекомендуемые настройки
| Тип рынка | Левые бары | Правые бары | Размер зоны |
|-------------|-----------|------------|-----------|
| Forex | 15 | 15 | 0.3 |
| Акции | 20 | 10 | 0.2 |
| Криптовалюта | 25 | 15 | 0.5 |
| Индексы | 15 | 10 | 0.3 |
## 🚀 Начало работы
1. Добавьте индикатор на ваш график
2. Наблюдайте начальные уровни и их силу
3. Ждите, пока цена приблизится к сильным уровням
4. Следите за сигналами пробоя с оценками качества
5. Входите на высококачественных пробоях (>70%)
6. Используйте зоны для установки стоп-лоссов
---
Сводка
The indicator displays configurable support and resistance zones using ATR multipliers, providing a realistic market representation beyond single lines. Breakout signals include quality scores derived from volume surges, candle body size, close position, and level strength, with color-coded quality indicators (lime for high, yellow for moderate, orange for low).
Breakout signals are labeled ("B" for volume-confirmed breakouts, "Bull Wick" for bullish rejections, and "Bear Wick" for bearish rejections). Volume oscillators assist in confirming breakout validity. Settings allow customization of pivot detection bars, zone size, and display options.
Suitable for various trading styles—including day trading, swing trading, and scalping—this indicator supports multiple timeframes and markets such as Forex, stocks, crypto, and indices. It is intended for traders of all experience levels seeking to identify and trade key levels, breakouts, and ranges with volume-based confirmation.
Отзывы покупателей
5 | 50 % | |
4 | 50 % | |
3 | 0 % | |
2 | 0 % | |
1 | 0 % |
























![Логотип продукта "Gaussian Channel [Iridio Capital]"](https://cdn.ctrader.com/image/webp/2c4f9ca9-4e9b-476d-b5a6-787c8095032b_61546)



