Deskripsi
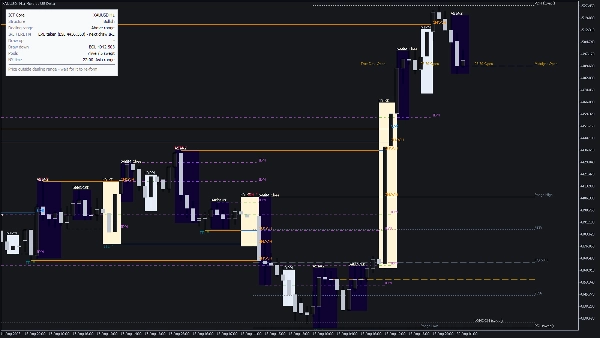
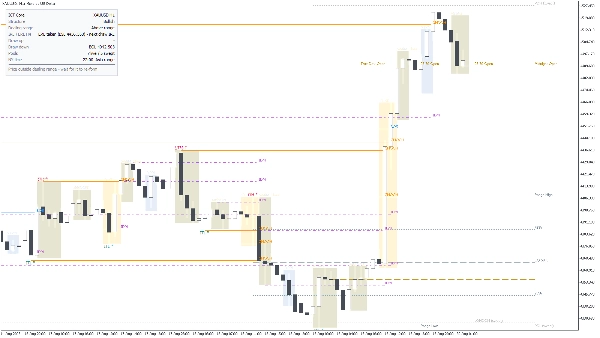
ICT Core mengubah grafik harga mentah menjadi pembacaan Smart Money Concepts (ICT) yang terstruktur: struktur pasar, kolam likuiditas, rentang perdagangan, status IRL / ERL, sesi New York dan killzone, plus panel yang menyatakan bias saat ini dan rencana kondisional dalam bahasa Inggris yang sederhana. Ini hanya menggambar dari aksi harga yang sudah tertutup dan terkonfirmasi - setelah level atau label dicetak, itu tetap di tempatnya.
APA YANG DIANALISIS
ICT Core membaca data bar (buka / tinggi / rendah / tutup) dari simbol grafik, plus satu timeframe lebih tinggi pilihan Anda (default H4) untuk pembacaan IRL / ERL. ATR digunakan untuk mengukur ukuran ayunan, jarak label, dan toleransi equal-high / equal-low, sehingga pengaturan yang sama berperilaku konsisten pada XAUUSD, indeks, dan FX. Waktu sesi dan killzone dihitung dalam waktu New York dengan penanganan DST otomatis, bukan dalam jam broker tetap.
APA YANG DIGAMBAR DAN BAGAIMANA MEMBACANYA
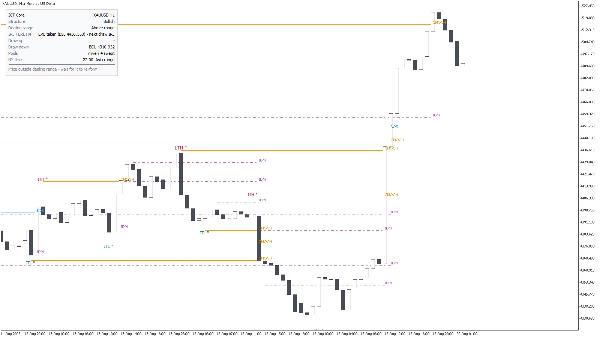
- Struktur pasar. Ayunan diklasifikasikan sebagai jangka pendek, jangka menengah, dan jangka panjang. Break diberi label BOS (lanjutan) atau CHOCH (perubahan karakter); break yang hanya dibuat oleh sumbu diberi tag terpisah sebagai sweep, sehingga Anda dapat membedakan perpindahan nyata dari raid. Puncak dan lembah yang diambil oleh kaki impulsif diberi tag kuat / lemah.
- Inducement (IDM). Puncak atau lembah kecil yang kemungkinan akan dilalui harga sebelum pergerakan sebenarnya ditandai, sehingga Anda dapat melihat jebakan sebelum terjadi.
- Kolam likuiditas. Tinggi dan rendah hari sebelumnya, minggu sebelumnya, bulan sebelumnya, sesi, dan equal highs / equal lows digambar sebagai level sisi beli (BSL) dan sisi jual (SSL). Setelah kolam disapu, itu dibuat redup daripada dihapus, sehingga riwayat apa yang sudah diambil tetap dapat dibaca.
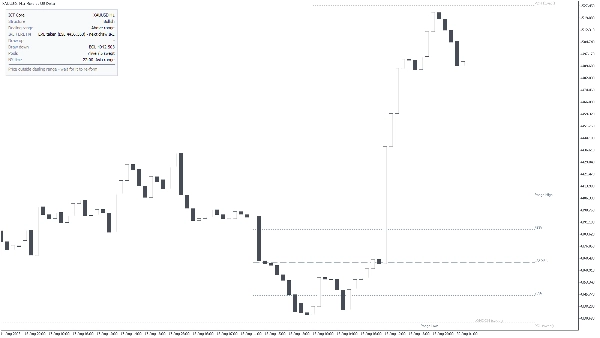
- Rentang perdagangan. Rentang aktif antara tinggi dan rendah valid terakhir, dengan kuadran 25% / 75% opsional untuk referensi premium / diskon.
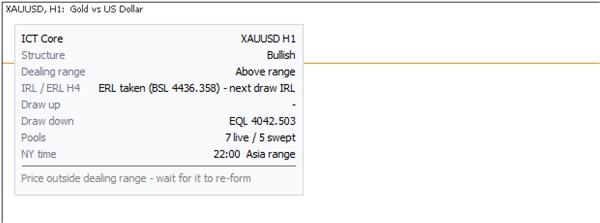
- IRL / ERL. Panel menyatakan apakah likuiditas eksternal telah diambil dan gambar berikutnya adalah internal, atau sebaliknya, dibaca dari timeframe lebih tinggi yang Anda pilih.
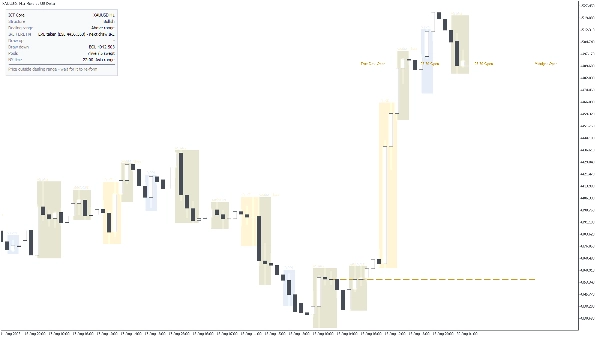
- Sesi dan waktu. Kotak Asia, London, NY AM dan NY PM; killzone London, New York dan penutupan London; jendela silver bullet; makro 20 menit opsional; dan garis harga pembukaan sesi.
- Panel info. Simbol dan timeframe, bias struktur, posisi harga dalam rentang perdagangan, status IRL / ERL, gambar terdekat di atas dan bawah dengan harganya, berapa banyak kolam yang aktif versus yang sudah disapu, waktu New York dan sesi aktif - plus baris rencana kondisional seperti "Harga di luar rentang perdagangan - tunggu sampai terbentuk kembali".
- Peringatan. Popup, suara, atau email saat kolam disapu, pada BOS / CHOCH, dan saat killzone dibuka.
PENGATURAN UTAMA
- Umum: tema grafik (auto / terang / gelap), bar yang dianalisis (default 1500), ukuran font label, dan jarak antar label yang diatur (dalam ATR).
- Struktur pasar: kekuatan ayunan dalam bar di setiap sisi (default 2), tier ayunan mana yang ditampilkan, BOS / CHOCH aktif atau tidak, break hanya sumbu aktif atau tidak, inducement aktif atau tidak, dan ukuran impuls dalam ATR yang memenuhi syarat puncak atau lembah sebagai kuat (default 1.0).
- Kolam likuiditas: kolam mana yang digambar, toleransi equal high / low dalam ATR (default 0.15), berapa hari sebelum kolam kedaluwarsa (default 20), dan apakah kolam yang disapu tetap terlihat.
- Rentang perdagangan: rentang aktif atau tidak, kuadran 25% / 75% aktif atau tidak.
- IRL / ERL: timeframe sumber (default H4) dan berapa banyak bar yang dipindai (default 300).
- Sesi: kotak sesi, killzone, silver bullet, makro, harga pembukaan, berapa hari ke belakang untuk menggambar (default 5), dan opasitas isi kotak.
- Panel: sudut, offset X / Y, ukuran font, apakah menampilkan baris rencana, berapa banyak bar sweep masih dihitung sebagai baru (default 12), dan apakah rencana memerlukan killzone aktif.
- Peringatan dan set warna lengkap untuk setiap elemen di grafik.
PENGGUNAAN TIPIKAL
1. Tambahkan ICT Core ke grafik M5 - H1 dari XAUUSD, indeks, atau pasangan FX utama.
2. Baca panel dari atas ke bawah: bias, lokasi dalam rentang perdagangan, IRL / ERL, dan gambar terdekat di atas dan bawah.
3. Tunggu kolam likuiditas disapu di dalam killzone, lalu cari CHOCH melawan sweep pada timeframe entri Anda.
4. Gunakan gambar berlawanan yang ditampilkan di panel sebagai target, dan ekstrem yang disapu sebagai invalidasi.
5. Aktifkan peringatan sweep dan BOS / CHOCH jika Anda tidak ingin terus memantau grafik sepanjang sesi.
UNTUK SIAPA INI
Trader yang sudah bekerja dengan ICT / Smart Money Concepts dan menginginkan lapisan struktur, likuiditas, dan waktu dalam satu grafik daripada menggambarnya secara manual setiap hari. Ini ditujukan untuk trader intraday dan swing pendek yang bersifat diskresioner. Ini bukan alat panah beli / jual untuk pemula - Anda perlu tahu apa arti BOS, CHOCH, IDM, IRL, dan ERL untuk menggunakannya.
BATASAN PENTING DAN CATATAN PENGGUNAAN
- ICT Core adalah alat analisis dan visualisasi. Ini tidak melakukan pemesanan, tidak memberikan sinyal beli / jual, dan baris rencana adalah pengingat kondisional, bukan rekomendasi.
- Semua berasal dari ayunan yang terkonfirmasi, jadi titik struktur muncul hanya setelah jumlah bar yang diperlukan telah tertutup di setiap sisi (default 2). Tidak ada yang digambar ulang setelahnya.
- Waktu sesi dan killzone mengikuti waktu New York termasuk DST. Grafik Anda ditampilkan dalam waktu server broker, jadi kotak tidak akan sejajar dengan offset UTC tetap - ini memang disengaja.
- Pembacaan IRL / ERL timeframe lebih tinggi membutuhkan cukup riwayat pada timeframe tersebut; pada simbol dengan riwayat pendek ditampilkan sebagai tidak tersedia.
- Analisis terbatas pada jendela bar yang dianalisis (default 1500). Tingkatkan untuk riwayat lebih banyak, dengan biaya gambar pertama yang lebih berat.
- Berjalan di cTrader Desktop untuk Windows dan Mac. Indikator kustom tidak tersedia di mobile atau web.
- Trading melibatkan risiko. Perilaku masa lalu dari pola apa pun tidak menjamin hasil di masa depan. Selalu gunakan manajemen risiko Anda sendiri.
Ringkasan
ICT Core highlights liquidity pools from previous days, weeks, months, and sessions, showing buy-side and sell-side levels, and dims swept pools to maintain historical context. It also delineates session times and killzones based on New York time with automatic daylight saving adjustments. An info panel provides a summary of current bias, price position within the dealing range, IRL/ERL status, nearest levels, live versus swept pools, and a conditional trading plan in plain English.
Users can customize settings including chart theme, swing parameters, liquidity pool visibility, session displays, and alert notifications for pool sweeps, BOS/CHOCH events, and killzone openings. ICT Core is intended for traders familiar with ICT/SMC concepts seeking an integrated, structured view of market dynamics for intraday and short-swing discretionary trading.