Описание
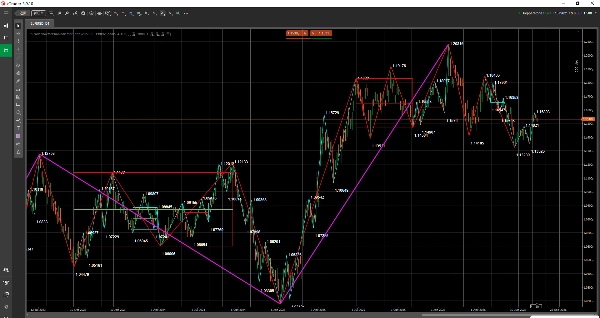
Индикатор структуры Boshi Chanlun для cTrader — это индикатор технического анализа структуры рынка / наложения на график, используемый для отображения структур Chanlun на графиках cTrader.
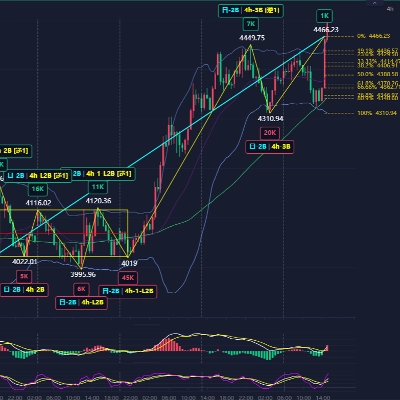
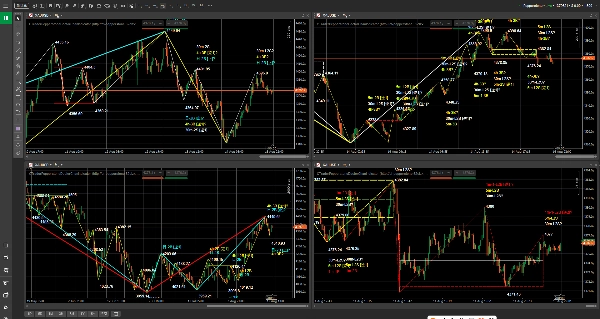
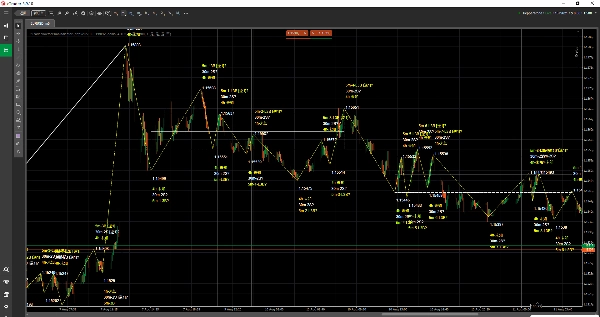
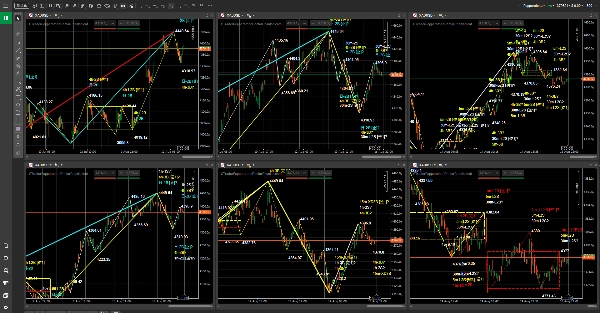
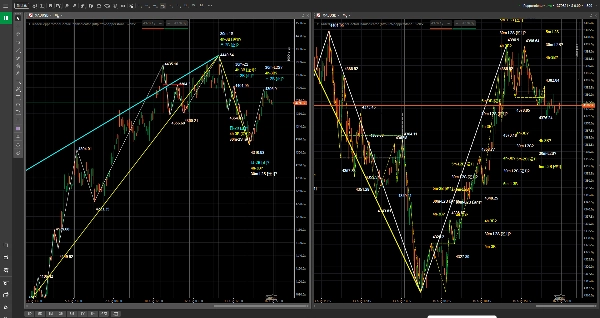
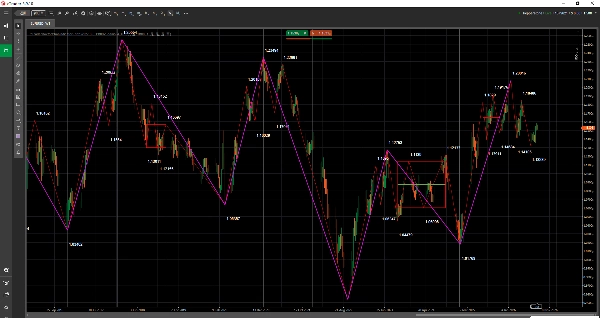
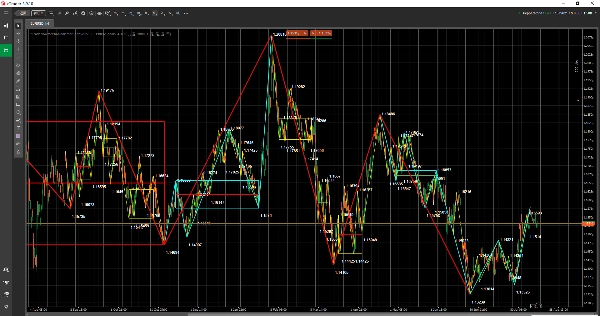
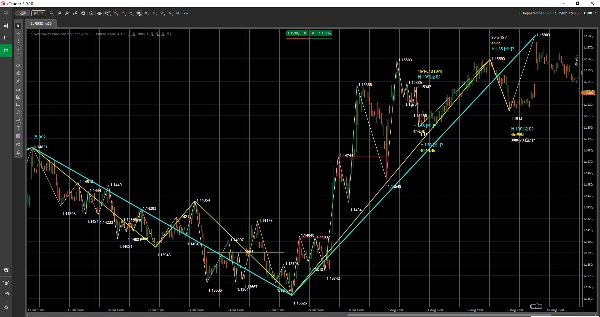
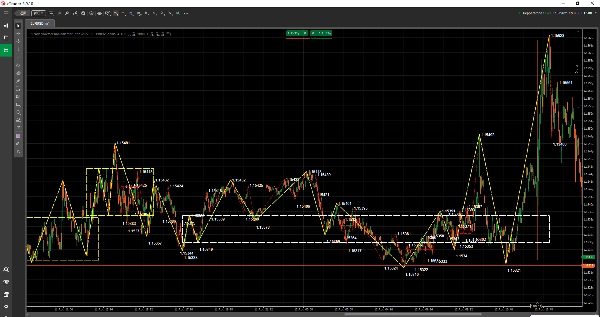
Он подходит для трейдеров, которые сосредоточены на ценовом действии, структуре тренда и анализе на нескольких таймфреймах. Индикатор отображает ключевые структуры Chanlun в виде объектов на графике, включая структуры Bi, зоны Zhongshu, маркеры покупки/продажи и многое другое, помогая пользователям более интуитивно наблюдать ритм рынка, структурные изменения и взаимосвязи между разными таймфреймами.
Этот индикатор не является автоматическим торговым роботом и не представляет собой сервис торговых сигналов. Его цель — помочь пользователям лучше читать графики, анализировать рынки и строить торговые планы.
Текущая версия совместима с указанными символами и таймфреймами Pepperstone cTrader. Этот продукт является независимым сторонним индикатором и не является официальным продуктом Pepperstone или продуктом партнёра Pepperstone.
Обзор индикатора
- Тип индикатора: индикатор структуры рынка / наложения на график.
- Предпочтительные инструменты: указанные символы Forex, индексов, товаров, криптовалют и CFD на акции в Pepperstone cTrader.
- Предпочтительные таймфреймы: 1 минута, 5 минут, 15 минут, 30 минут, 1 час, 4 часа, дневной, недельный и месячный.
- Сценарии использования в торговле: наблюдение структуры графика, анализ на нескольких таймфреймах, подготовка торгового плана и поддержка обзора.
Что вы можете увидеть на графике
- Структуры Bi: используются для наблюдения ритма колебаний и прогрессии структуры.
- Зоны Zhongshu: используются для наблюдения важных областей консолидации, баланса и структурного перекрытия.
- Маркеры покупки/продажи: помогают определить ключевые структурные опорные точки.
- Текстовые метки, горизонтальные линии, вертикальные линии, прямоугольные области, трендовые линии и другие объекты графика.
- По умолчанию поддерживается автоматическое сопоставление данных с текущим таймфреймом графика, что облегчает наблюдение на нескольких таймфреймах.
Для кого этот индикатор
- Пользователи, изучающие или использующие индикатор структуры Boshi Chanlun и анализ структуры Chanlun.
- Пользователи, желающие видеть информацию о структуре непосредственно на графиках cTrader.
- Пользователи, использующие Pepperstone для просмотра Forex, индексов, товаров, криптовалют или CFD на акции.
- Трейдеры, которым необходимо сравнивать структуры тренда на разных таймфреймах.
- Пользователи, желающие сделать процессы чтения графиков, планирования и обзора более понятными.
Доступ и лицензирование
Доступ к продукту и лицензирование управляются через процесс покупки, пробного использования и установки в cTrader Store. Пожалуйста, смотрите статус покупки, статус пробного периода и информацию о продукте на странице продукта в cTrader Store.
В настоящее время поддерживаемые символы Pepperstone
Forex:
GBPUSD, EURUSD, USDJPY, USDCHF, AUDUSD, USDCAD, GBPJPY
Индексы:
US500, NAS100, GER40, UK100, JPN225, VIX, HSTECH
Товары:
XAUUSD, XAGUSD
Криптовалюты:
BTCUSD, ETHUSD
Акции:
AAPL.US-24, MSFT.US-24, GOOG.US-24, AMZN.US-24, TSLA.US-24, NVDA.US-24, META.US-24, NFLX.US-24, JPM.US-24
Поддерживаемые таймфреймы
1 минута, 5 минут, 15 минут, 30 минут, 1 час, 4 часа, дневной, недельный и месячный.
Рекомендуемый рабочий процесс
1. Откройте график поддерживаемого символа в среде Pepperstone cTrader.
2. Загрузите индикатор Boshi Chanlun Structure Indicator на график.
3. Время данных индикатора Boshi Chanlun Structure Indicator — UTC+0. При проверке структур графика убедитесь, что переключили часовой пояс графика cTrader на соответствующий перед сравнением позиций.
4. Убедитесь, что текущий таймфрейм графика поддерживается. Индикатор автоматически сопоставляет данные с таймфреймом графика.
5. Включайте или выключайте «Show Bi», «Show Zhongshu» и «Show Buy/Sell» по мере необходимости.
6. Наблюдайте структуру графика вместе с вашим торговым планом, управлением позициями и контролем рисков.
Настройки параметров
Текущая версия предоставляет только следующие 3 видимых параметра в панели индикатора cTrader. Таймфрейм данных, суффикс символа брокера, кэш, обновление, сжатая передача и настройки логирования управляются внутренне индикатором и не требуют настройки для обычного использования.
Show Bi
Значение по умолчанию: "true"
Отображать ли структуры Bi.
Show Zhongshu
Значение по умолчанию: "true"
Отображать ли зоны Zhongshu.
Show Buy/Sell
Значение по умолчанию: "true"
Отображать ли маркеры покупки/продажи.
Важные замечания
- Этот продукт является индикатором помощником технического анализа, а не автоматическим торговым роботом.
- Индикатор не размещает ордера автоматически.
- Индикатор не является инвестиционной рекомендацией, сервисом торговых сигналов или гарантией прибыли.
- Текущая версия совместима только с указанными символами Pepperstone cTrader и указанными таймфреймами.
- Время данных индикатора Boshi Chanlun Structure Indicator — UTC+0. При отображении на графике cTrader переключайтесь на соответствующий часовой пояс графика перед проверкой позиций структуры.
- Пользователи должны использовать его вместе со своим торговым планом, управлением позициями, контролем рисков и независимым суждением.
Направление будущих обновлений
Текущая версия релиза ориентирована на указанные символы и таймфреймы Pepperstone cTrader. В будущих обновлениях планируется расширение поддержки большего числа брокеров, большего количества отображаемых символов и более полного охвата сервиса данных согласно плану продукта.
Предупреждение о рисках
Торговля на финансовых рынках связана с риском. Прошлые результаты не гарантируют будущих. Этот индикатор является лишь инструментом технического анализа и обучения. Он не представляет собой инвестиционную рекомендацию, сервис торговых сигналов или гарантию прибыли. Исторические структуры не отражают будущие результаты. Пользователи должны полностью протестировать его в своей торговой среде и использовать с осторожностью вместе с правилами управления рисками.
Сводка
Compatible with selected Forex pairs (e.g., GBPUSD, EURUSD), indices (e.g., US500, NAS100), commodities (XAUUSD, XAGUSD), cryptocurrencies (BTCUSD, ETHUSD), and major US stock CFDs (e.g., AAPL, MSFT, TSLA), it automatically matches data to the current chart timeframe. Users can toggle the display of Bi structures, Zhongshu zones, and buy/sell markers via simple parameters.
This indicator serves as a chart reading and market review assistant, not an automated trading system or signal provider. It requires users to apply their own trading plans, risk management, and judgment. Data time is based on UTC+0, so chart time zone adjustments are necessary for accurate structure positioning. Access and licensing are managed through the cTrader Store.
Отзывы покупателей
5 | 0 % | |
4 | 100 % | |
3 | 0 % | |
2 | 0 % | |
1 | 0 % |