Deskripsi
Dynamic Volume Profile
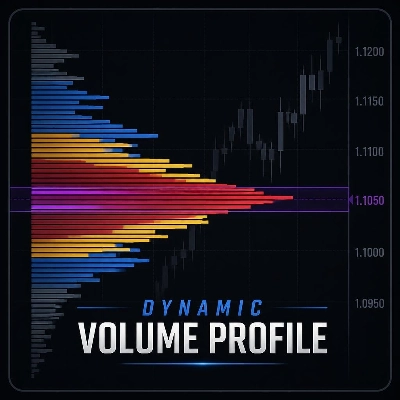
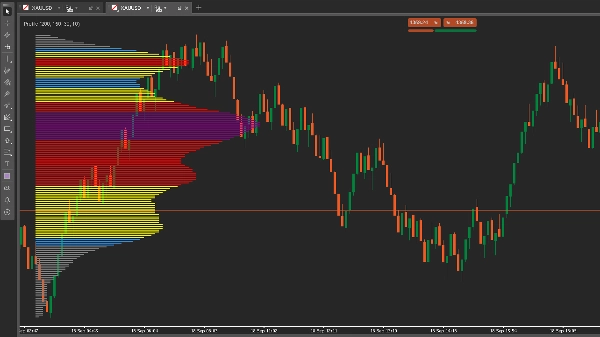
A fixed and customizable range Volume Profile designed to optimize the visual reading of volume distribution and adapt the profile to different market analysis approaches.
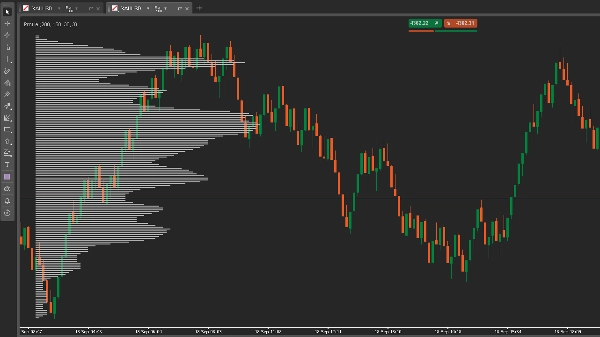
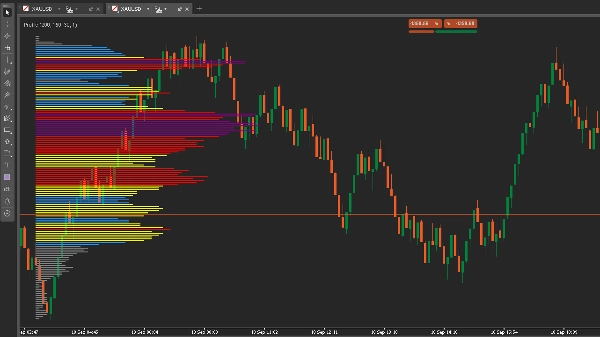
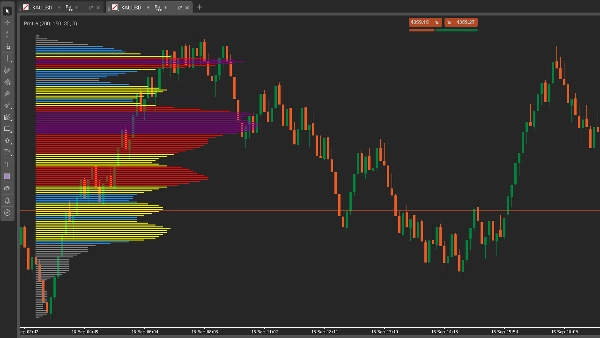
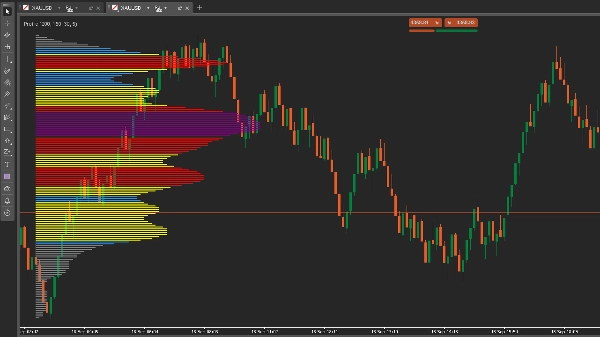
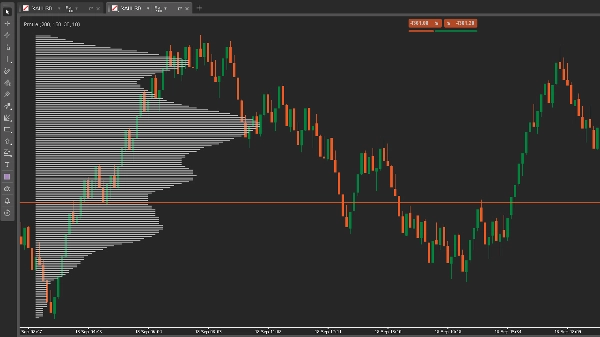
The indicator allows you to select a specific candle window and build a volume profile distributed across price levels, with configurable smoothing and customizable colors based on the relative strength of each region.
In addition to traditional time-based charts, the indicator can be used on non-time-based charts, such as Range and Tick charts, allowing you to analyze volume distribution within a defined window independently of the passage of time.
Key Features
Fixed Range Volume Profile
Define the number of candles used for the analysis through the Bars Back parameter.
The indicator builds the profile using the highest and lowest prices within the selected window, allowing you to maintain a consistent analysis area while following the chart.
Tick Volume Distribution
The profile uses Tick Volume to represent activity within the analyzed region.
The distribution is built using the available volume data and is designed to represent the concentration of activity across different price levels within the selected window.
Important: The indicator uses Tick Volume. It does not represent financial volume or the actual number of contracts traded.
Configurable Smoothing
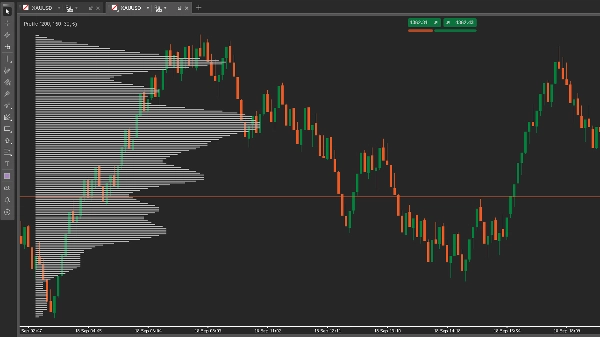
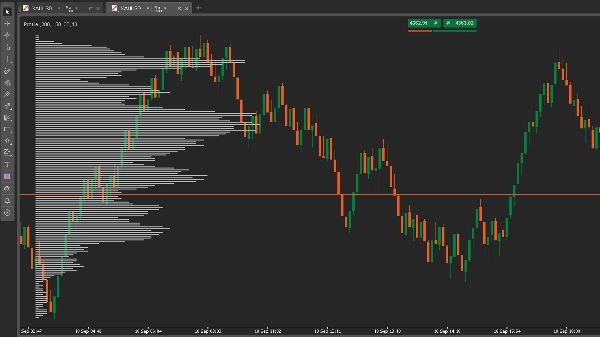
The Smooth Radius parameter controls the smoothing applied to the volume distribution on a scale from 1 to 10.
The setting can be adjusted according to the objective of the analysis:
- 1 — minimal smoothing and greater preservation of local variations.
- 3 — light smoothing, useful for reducing small visual noise without excessively changing the profile structure.
- 5 — an intermediate option for situations where significant noise remains with lower smoothing.
- Above 5 — can be used for specific analyses where the objective is to observe a broader volume distribution toward areas of greater concentration.
For analyses requiring greater preservation of distribution details, use lower values.
For analyses focused more on the overall profile structure, higher values can provide a cleaner visual representation.
Visual Strength Identification
Different profile regions are visually classified according to their relative volume intensity.
This makes it easier to quickly distinguish areas of higher and lower concentration without having to interpret every individual price level.
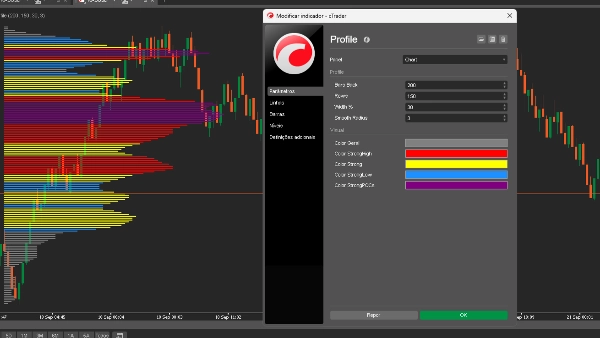
Each category has its own customizable color.
Customizable Colors
Customize the colors used by the indicator to create a visual reference suited to your own analysis methodology.
Color customization can help:
- reduce visual load;
- create consistent references;
- identify regions more quickly;
- adapt the indicator to your chart theme;
- make prolonged analysis more practical.
The goal is to allow each user to develop their own visual language for the profile.
Profile Resolution
The Rows parameter controls the number of price levels used to build the profile.
Higher values provide a more detailed representation of the distribution, while lower values produce a more simplified visualization.
Profile Width
The Width % parameter controls the maximum width of the Volume Profile on the chart.
This allows you to adapt the profile size to the available chart space while keeping the indicator integrated with price action.
Parameters
Bars Back
Defines the number of candles used in the analysis window.
Rows
Defines the vertical resolution of the profile.
Row thickness
Sets the line thickness.
Width %
Defines the maximum profile width relative to the analyzed window.
Smooth Radius
Controls the level of smoothing applied to the volume distribution, from 1 to 10.
Color General
Color used for general profile regions.
Color StrongHigh
Color used for regions classified as Strong High.
Color Strong
Color used for intermediate regions of higher concentration.
Color StrongLow
Color used for regions classified as Strong Low.
Color Strong POCs
Color used for the highest-concentration regions identified by the indicator.
Indicator Philosophy
This indicator was developed with a focus on optimizing the visual analysis of Volume Profile.
Instead of presenting only a uniform volume distribution, the goal is to make different concentration regions easier to identify through:
- configurable analysis range;
- price-level distribution;
- adjustable smoothing;
- visual intensity classification;
- customizable colors;
- support for non-time-based charts.
The intention is to make profile analysis faster, cleaner, and more practical, reducing the need to visually interpret small fluctuations that may make the overall structure harder to identify.
Recommended Uses
The indicator can be used as a complementary tool for analyzing:
- market structure;
- volume concentration;
- areas of interest;
- support and resistance;
- POC and surrounding regions;
- intraday analysis;
- volume distribution studies.
The appropriate configuration depends on the instrument, chart structure, and objective of the analysis.
Internal Methodology
The specific methods used to determine the smoothing levels and strength classifications are not detailed in this description.
The purpose is to explain the indicator's functionality and available features without exposing the internal methodology used by the indicator.
Disclaimer
This indicator is a technical and visual analysis tool.
The displayed regions represent the relative distribution of Tick Volume within the selected window and should not be interpreted independently as buy or sell signals.
Past results or interpretations of the indicator do not guarantee future results.