
Description
Visualisation de la tendance :
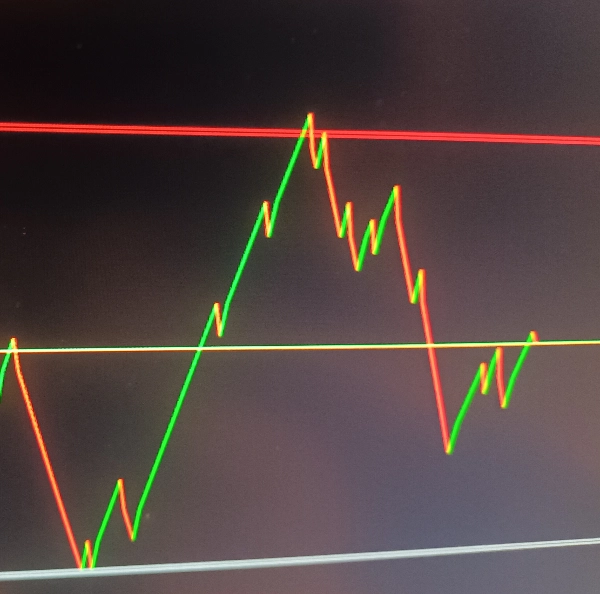
Trace des lignes de tendance (vert pour la tendance haussière, rouge pour la tendance baissière) basées sur les changements de direction des prix
Trace une ligne de prix jaune sur le graphique
Zones de support/résistance :
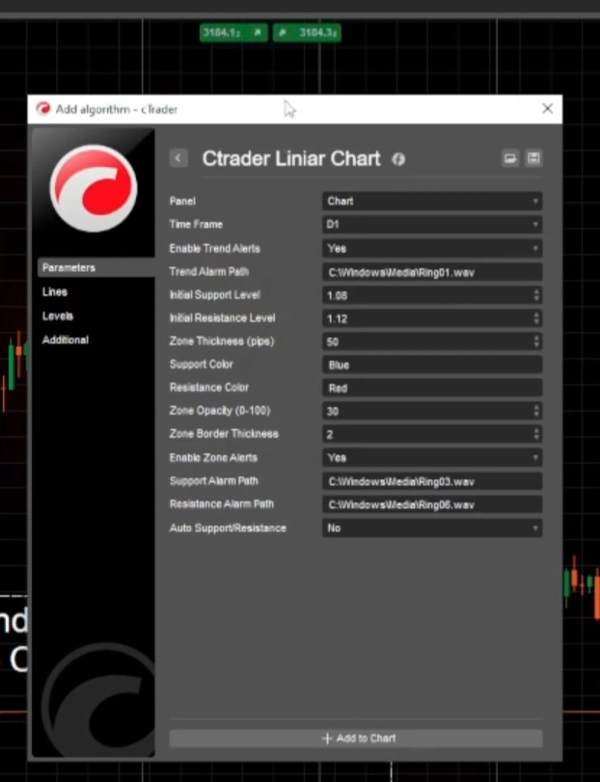
Niveaux de support et de résistance configurables avec une épaisseur ajustable (en pips)
Couleurs personnalisées et opacité pour les zones
Zones interactives pouvant être ajustées manuellement sur le graphique
Système d'alerte :
Alertes de changement de tendance (lorsque la direction du prix change)
Alertes de franchissement des zones de support/résistance
Alertes sonores personnalisées pour différents événements
Support/Résistance automatique :
Ajustement automatique optionnel des niveaux de support/résistance lorsque les tendances changent
Comment ça fonctionne
Configure la période sélectionnée (par défaut Quotidien)
niveaux de support/résistance avec des valeurs par défaut ou définies par l'utilisateur
Démarre un minuteur pour vérifier périodiquement les ajustements des zones
Logique de calcul
Pour chaque barre, compare le prix de clôture actuel avec le prix de clôture précédent
Détermine la direction actuelle de la tendance (haussière/baissière)
Trace une ligne de tendance entre les prix actuels et précédents
Si la direction de la tendance change :
Met à jour automatiquement les niveaux de support/résistance en option
Déclenche les alertes de tendance (si activées)
Vérifie si le prix entre dans les zones de support/résistance et déclenche les alertes en conséquence
Gestion des zones
Les zones de support/résistance sont dessinées sous forme de rectangles semi-transparents
Les zones peuvent être ajustées manuellement sur le graphique et l'indicateur suivra ces modifications
L'épaisseur des zones est configurable en pips
Types d'alerte
Alertes de tendance : déclenchées lorsque le prix change de direction (haussière/baissière)
Alertes de zone : déclenchées lorsque le prix entre dans les zones de support/résistance
Alertes de niveau automatique : lorsque le support/résistance automatique est activé, alertes lors de l'ajustement automatique de ces niveaux
Sélection de la période
Activation/désactivation des différents types d'alerte
Chemins des fichiers sonores personnalisés pour différentes alertes
Niveau de support/résistance .
Résumé
The indicator features configurable support and resistance zones displayed as semi-transparent rectangles, with adjustable thickness in pips, customizable colors, and opacity. These zones are interactive and can be manually adjusted on the chart, with the indicator tracking any changes.
An alert system notifies users of trend changes, price entries into support/resistance zones, and automatic adjustments of these levels if the auto-support/resistance feature is enabled. Alerts can be customized with different sound files and can be enabled or disabled individually.
The indicator periodically checks for zone adjustments and updates support/resistance levels automatically when trends change, if configured. It supports time frame selection and provides a comprehensive visual and alert-based approach to monitoring price trends and critical levels in trading charts.


