คำอธิบาย
📈 Stochastic RSI
ตัวชี้วัด Stochastic RSI เป็นออสซิลเลเตอร์โมเมนตัมที่ใช้ สูตร Stochastic กับค่าของ RSI แทนที่จะใช้ราคาทำให้เป็น ตัวชี้วัดอนุพันธ์อันดับสอง ซึ่งมีประโยชน์อย่างยิ่งในการระบุสภาวะที่ซื้อมากเกินไปและขายมากเกินไปด้วยความไวที่สูงกว่ามาตรฐาน RSI
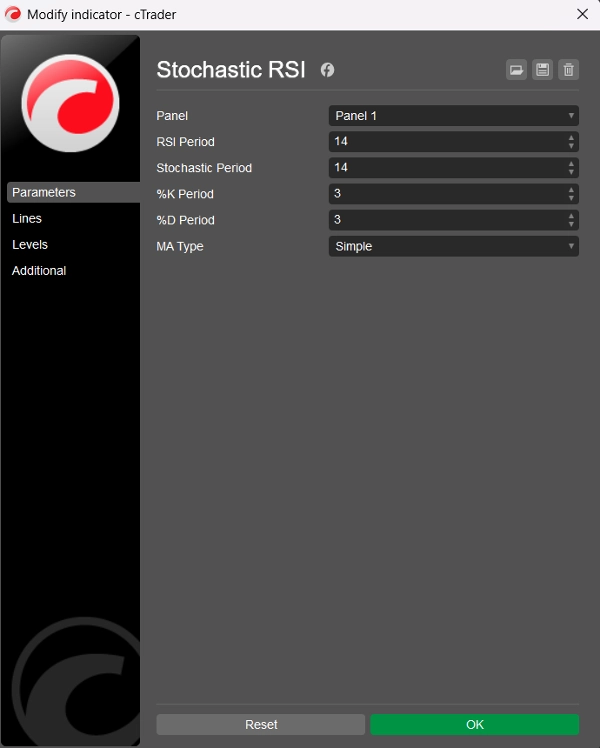
🛠️ พารามิเตอร์
ช่วง RSI: ช่วงเวลาย้อนหลังที่ใช้ในการคำนวณ RSI พื้นฐาน (ค่าเริ่มต้น = 14)
ช่วง Stochastic: ช่วงเวลาย้อนหลังที่ใช้กับค่าของ RSI เพื่อคำนวณ Stochastic RSI (ค่าเริ่มต้น = 14)
ช่วง %K: ช่วงเวลาการปรับค่าเฉลี่ยเคลื่อนที่ของเส้น %K (ค่าเริ่มต้น = 3)
ช่วง %D: ช่วงเวลาการปรับค่าเฉลี่ยเคลื่อนที่ของเส้น %D (ค่าเริ่มต้น = 3)
ประเภท MA: ประเภทค่าเฉลี่ยเคลื่อนที่สำหรับการปรับค่า: เลือกได้ 11 ประเภท (ค่าเริ่มต้น = แบบง่าย)
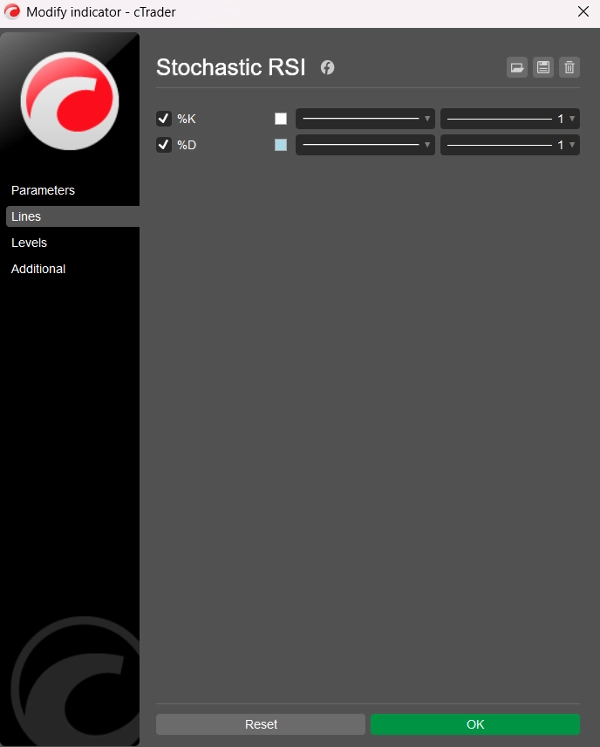
📊 เส้นผลลัพธ์
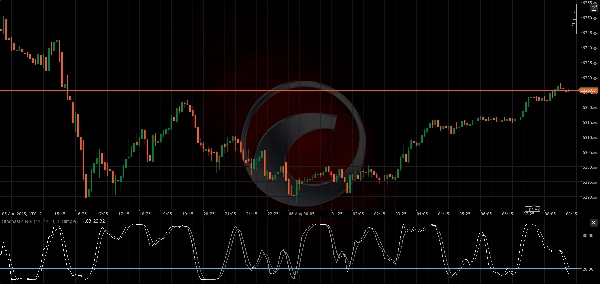
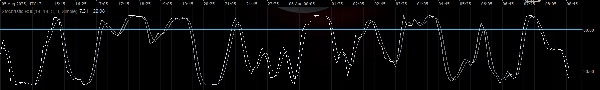
- เส้น %K: Stochastic RSI ที่ถูกปรับค่าเรียบ (สีขาว)
- เส้น %D: ค่าเฉลี่ยเคลื่อนที่ที่ปรับค่าเรียบของ %K (สีน้ำเงินอ่อน)
ทั้งสองเส้นแกว่งตัวระหว่าง 0 ถึง 100 ทำให้สามารถอ่านค่าสภาวะซื้อมากเกินไปและขายมากเกินไปได้อย่างชัดเจน
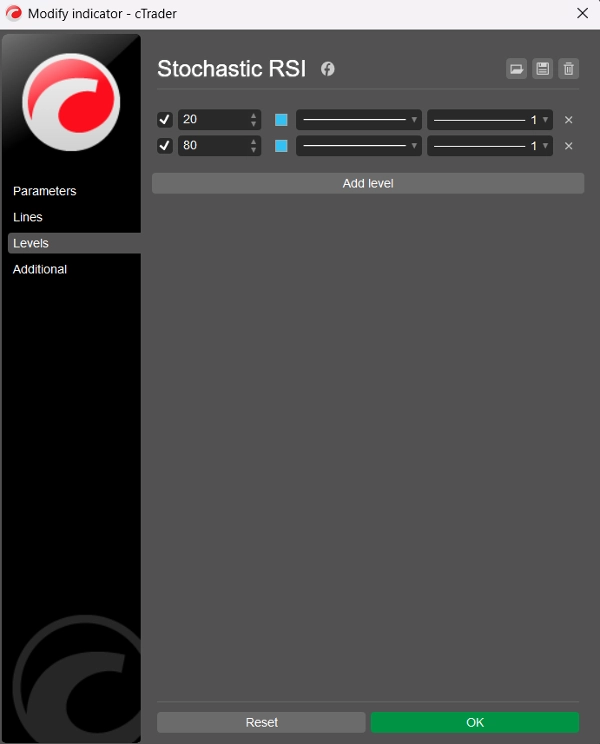
⚠️ ระดับที่แนะนำ
แม้ว่าตัวชี้วัดจะไม่แสดงระดับคงที่โดยค่าเริ่มต้น แต่แนะนำให้ผู้ใช้เพิ่มระดับเหล่านี้ ด้วยตนเองผ่านแท็บ “Levels” ใน cTrader:
- ระดับ 80 → ซื้อมากเกินไป
- ระดับ 20 → ขายมากเกินไป
ระดับเหล่านี้ทำงานคล้ายกับ Stochastic Oscillator แบบดั้งเดิมแต่ใช้กับพฤติกรรมของ RSI ทำให้สัญญาณมีความคมชัดและรวดเร็วขึ้นบ่อยครั้ง
🧠 วิธีใช้
- ซื้อมากเกินไป (>80): อาจบ่งชี้ว่าราคาขยายตัวขึ้นมากเกินไป — มีโอกาสกลับตัวหรือพักตัว
- ขายมากเกินไป (<20): อาจสัญญาณว่าราคาขายมากเกินไป — มีโอกาสเด้งกลับหรือกลับตัวแนวโน้ม
- การตัดกันของ %K และ %D: สามารถใช้ได้เหมือนกับ Stochastic หรือ MACD — การตัดกันขาขึ้นต่ำกว่า 20 หรือการตัดกันขาลงสูงกว่า 80 อาจเป็นสัญญาณที่ใช้ได้
🏷️ หมายเหตุ
- สร้างขึ้นสำหรับ cTrader โดยใช้ C# และ Automate API
- สะอาด มีประสิทธิภาพ และปรับแต่งได้ด้วย 11 ประเภท MA
- โค้ดและตรรกะโดย BlueRocketBots & ChatGPT (OpenAI)
- โค้ดสะอาด (รวม 99 บรรทัด; 54 บรรทัดโค้ด, 27 บรรทัดข้อความ, 18 บรรทัดว่าง)
- เวอร์ชันปรับปรุง V2
- ฟรี!
สรุป
Key parameters include the RSI Period (default 14), Stochastic Period (default 14), %K and %D smoothing periods (default 3 each), and a choice among 11 moving average types for smoothing (default is Simple). The indicator outputs two lines: the %K line (smoothed Stochastic RSI) and the %D line (smoothed moving average of %K), both oscillating between 0 and 100.
Suggested manual levels for interpretation are 80 (overbought) and 20 (oversold). Traders may use these levels along with %K and %D crossovers to identify potential price reversals or consolidations. For example, a bullish crossover below 20 or a bearish crossover above 80 can signal actionable market moves.
The indicator is implemented in clean, efficient C# code using the Automate API, allowing customization and integration within cTrader.