คำอธิบาย
⚠️ เราย้ายไปที่ 👉 PrimeQuant
🚫🚫🚫 อย่าซื้ออินดิเคเตอร์นี้!
อินดิเคเตอร์ OHLC PRO โดย LudwigICT เป็น เครื่องมือซ้อนกราฟที่มีฟีเจอร์หลากหลาย ที่ออกแบบมาเพื่อให้การแสดงผลข้อมูลที่เป็นมืออาชีพและเต็มไปด้วยข้อมูลบนกราฟ cTrader ของคุณ
นี่คือรายละเอียดของสิ่งที่มันทำ:
🔹 ฟังก์ชันหลัก: การซ้อน OHLC
- วาด แท่ง OHLC (เปิด, สูง, ต่ำ, ปิด) แบบกำหนดเอง บนกราฟของคุณ
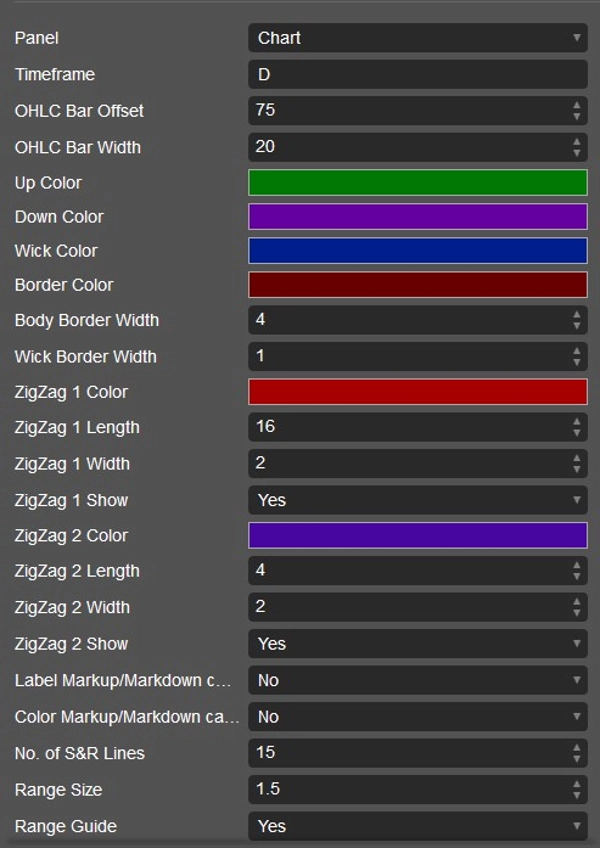
- คุณสามารถตั้งค่า:
-
- ช่วงเวลาของ OHLC ที่จะใช้ (รายวัน, รายสัปดาห์, รายเดือน หรือช่วงเวลาภายในวันเช่น H1, M15 เป็นต้น)
- การเลื่อนแท่ง (ระยะห่างจากแท่งเทียนปัจจุบัน)
- ความกว้างแท่ง, ไส้เทียน, ขอบ และสีที่กำหนดเอง
- โดยสรุป คุณจะได้ “แท่งเทียนอ้างอิง” จากช่วงเวลาที่สูงกว่าซ้อนอยู่บนกราฟปัจจุบันของคุณ
🔹 การตั้งค่า Triple-M (สัญญาณขาขึ้น/ขาลง)
- ตรวจจับ รูปแบบของจุดต่ำที่สูงขึ้นติดต่อกัน (ขาขึ้น) หรือ จุดสูงที่ต่ำลง (ขาลง).
- เมื่อพบรูปแบบ:
-
- สามารถวาง ไอคอนสามเหลี่ยม (ขึ้นหรือลง) บนแท่งเทียน
- สามารถ เปลี่ยนสีแท่งเทียน เพื่อแสดงการเปลี่ยนแปลงโมเมนตัม
- สิ่งนี้ทำหน้าที่เหมือน สัญญาณการเปลี่ยนแปลงโครงสร้างโมเมนตัม.
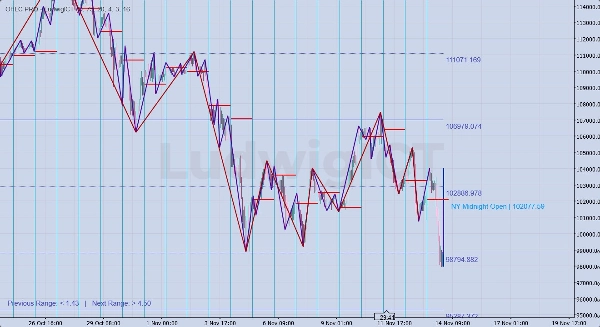
🔹 เครื่องมือ Dual ZigZag
- ซ้อน ZigZag สองอันที่แยกจากกัน:
-
- ZigZag #1 (ความยาวนานกว่า เช่น โครงสร้างสวิง)
- ZigZag #2 (ความยาวสั้นกว่า เช่น สวิงเล็กๆ)
- เน้นสวิงตลาดสำหรับ การวิเคราะห์โครงสร้าง, แนวโน้ม และการเบรคเอาท์.
🔹 แนวรับ & แนวต้านแบบ Gann
- ใช้ ตารางตัวเลข Gann + ตรรกะ ATR ในการคำนวณระดับ S/R
- วาดเส้นแนวรับ/แนวต้านหลายเส้นเหนือและใต้ราคา
- เส้นสามารถกำหนดสไตล์ได้ (เส้นทึบ, จุด, ขยายไปทางซ้าย ฯลฯ)
- ติดป้ายระดับด้วยค่าราคา
- ยังให้ คู่มือช่วงราคา:
-
- “ช่วงราคาก่อนหน้า” เทียบกับ “ช่วงราคาถัดไป” โดยสัมพันธ์กับ ATR
- ช่วยทำนายโซนการขยายตัวหรือการหดตัว
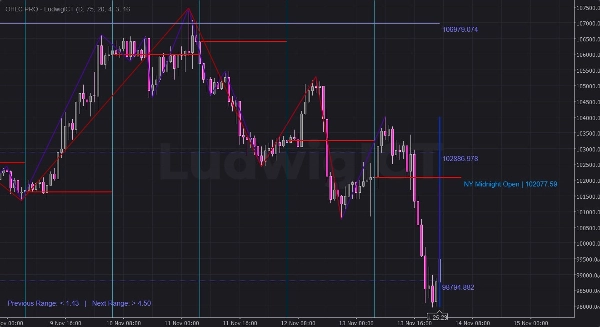
🔹 ระดับเที่ยงคืนของนิวยอร์ก
- ตรวจจับโดยอัตโนมัติ ราคาปิดเปิดเที่ยงคืนของช่วงเวลานิวยอร์ก.
- วาด:
-
- เส้นแนวนอน ที่ราคาปิดเปิดเที่ยงคืนของนิวยอร์ก
- เส้นแนวตั้ง ที่จุดเริ่มต้นของช่วงเวลา
- ป้ายแสดง “NY Midnight Open | ราคา”
- คุณสามารถขยายเส้นเหล่านี้ได้ 1 หรือ 2 วัน หรือเพิ่มชั่วโมงเพิ่มเติม
- มีประโยชน์สำหรับการเทรดสไตล์ ICT (อคติช่วงเวลานิวยอร์ก, จุดสมดุล ฯลฯ)
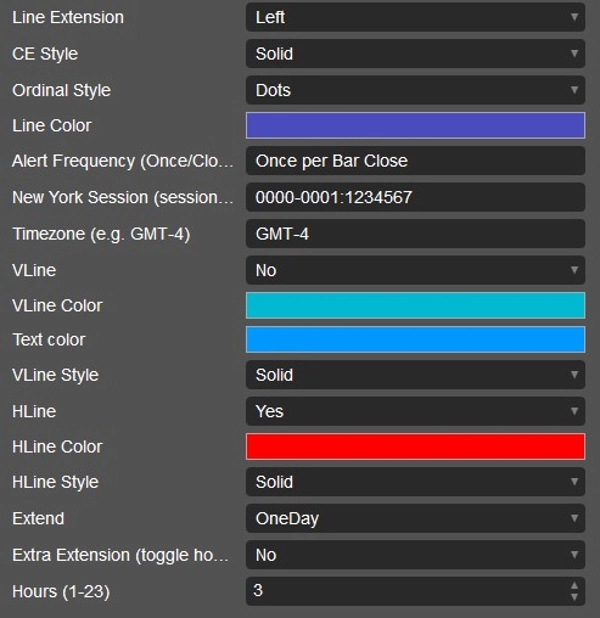
🔹 การปรับแต่ง & การแจ้งเตือน
- ทุกฟีเจอร์มี พารามิเตอร์ในเมนูดรอปดาวน์:
-
- สี, สไตล์, การขยายเส้น, จำนวนเส้น ฯลฯ
- รองรับการแจ้งเตือน (แม้ว่าจะเน้นที่การแสดงผลบนกราฟเป็นหลัก — มีพารามิเตอร์ความถี่การแจ้งเตือน)
- ลบอย่างสะอาดเมื่อปิดอินดิเคเตอร์ (เพื่อไม่ให้กราฟของคุณรก)
✅ โดยสรุป:
อินดิเคเตอร์นี้เป็น เครื่องมือวิเคราะห์ราคาหลายฟังก์ชัน รวม:
- แท่งเทียน OHLC ช่วงเวลาที่สูงกว่า
- สัญญาณรูปแบบโมเมนตัม (Triple-M)
- โครงสร้าง ZigZag สองชุด
- ระดับ S/R แบบ Gann + คู่มือช่วงราคา
- เครื่องหมายเปิดเที่ยงคืนช่วงเวลานิวยอร์ก
มันถูกสร้างขึ้นเพื่อ การเทรดที่อิงโครงสร้าง, ช่วงเวลา และระดับราคา โดยเฉพาะอย่างยิ่งเหมาะสำหรับเทรดเดอร์สไตล์ ICT หรือเทรดเดอร์ที่เน้นการเคลื่อนไหวราคา
ผมอธิบาย วิธีที่คุณสามารถใช้มันได้จริงเมื่อเทรด XAU/USD
🔹 การใช้งานเทรดจริง (ทองคำกับ OHLC PRO)
1. การซ้อน OHLC ช่วงเวลาที่สูงกว่า
- ตัวอย่าง: วาด OHLC รายวัน ขณะเทรดบน M5/M15
- คุณจะเห็นแท่งเทียนของเมื่อวาน “อยู่ภายใน” กราฟช่วงเวลาภายในวันของคุณ
- การใช้งาน:
-
- ราคากำลังเข้าใกล้ จุดสูง/ต่ำของวันก่อนหน้า = โซนล่าของสภาพคล่อง
- ราคาเปิด/ปิดรายวัน = ตัวกรองอคติ (เหนือ = ขาขึ้น, ต่ำกว่า = ขาลง)
- ช่วยให้คุณเทรด ภายในช่วงราคารายวัน.
👉 บนทองคำ ช่วงเวลานิวยอร์กมักจะบุกเข้าไปที่ จุดสูง/ต่ำของวันก่อนหน้า ก่อนที่จะกลับตัว
2. สัญญาณ Triple-M
- รูปแบบ Triple-M (ชุดของจุดต่ำที่สูงขึ้นหรือต่ำที่ลดลง) = โมเมนตัมระยะสั้น
- การใช้งาน:
-
- Triple-M ขาขึ้นใกล้ แนวรับ (จุดต่ำ HTF หรือเปิดเที่ยงคืน NY) → อาจเป็นจุดเข้าซื้อระยะสั้น
- Triple-M ขาลงใกล้ แนวต้าน (จุดสูง HTF หรือระดับ Gann) → อาจเป็นจุดเข้าขายระยะสั้น
- สามารถเปลี่ยนสีแท่งเทียนเพื่อการจดจำด้วยสายตาอย่างรวดเร็วในช่วงที่ทองคำเคลื่อนไหวเร็ว
👉 ใช้งานได้ดีสำหรับ การเข้าซื้อแบบซุ่มยิง บน M1–M5 เมื่อสอดคล้องกับอคติ HTF
3. Dual ZigZag
- ZigZag #1 (ความยาวนานกว่า) = โครงสร้างสวิง
- ZigZag #2 (ความยาวสั้นกว่า) = โครงสร้างเล็ก
- การใช้งาน:
-
- ระบุ การเบรคโครงสร้างตลาด (BOS/CHOCH)
- เทรดเฉพาะในทิศทางของ ZigZag ที่ใหญ่กว่า (#1)
- ใช้ ZigZag ที่เล็กกว่า (#2) เพื่อยืนยันการเข้าเทรด
👉 ตัวอย่าง: อคติรายวันเป็นขาขึ้น → รอ ZigZag #2 เปลี่ยนเป็นขาขึ้นใกล้แนวรับ HTF
4. แนวรับ & แนวต้านแบบ Gann
- สร้างกริดของ ระดับ S/R ทางคณิตศาสตร์.
- การใช้งาน:
-
- ถ้าราคากำลังรวมตัว ระดับเหล่านี้จะบ่งชี้จุดเบรคเอาท์ที่น่าจะเกิดการขยายตัว
- ผสมผสานกับคู่มือช่วง ATR:
-
- "ช่วงราคาก่อนหน้า" เล็ก → คาดการณ์การขยายตัวของความผันผวน
- "ช่วงราคาถัดไป" สูง → ระดับเบรคเอาท์ที่แข็งแกร่งข้างหน้า
👉 บนทองคำ ระดับ Gann มักจะสอดคล้องกับเลขกลม (เช่น 2400, 2420, 2435)
5. เปิดเที่ยงคืนช่วงเวลานิวยอร์ก
- นี่คือหนึ่งใน เครื่องมือ ICT ที่ทรงพลังที่สุด สำหรับทองคำ
- การใช้งาน:
-
- ราคาสัมพันธ์กับเปิดเที่ยงคืน NY = อคติทิศทาง
- ถ้าราคายังคง เหนือราคาเปิดเที่ยงคืน → ช่วงเวลานิวยอร์กเป็นขาขึ้น
- ถ้าต่ำกว่า → อคติขาลง
- เส้นแนวนอนทำหน้าที่เป็น จุดสมดุล (50%) อ้างอิง.
- เฝ้าดูการกวาดสภาพคล่องรอบระดับนี้ในโซนฆ่าของลอนดอน/นิวยอร์ก
👉 ตัวอย่าง:
เปิดเที่ยงคืน NY = 2405.
- ถ้าลอนดอนดันราคาลงไปที่ 2398 และนิวยอร์กกลับขึ้นมา 2405 → การตั้งค่าซื้อที่แข็งแกร่ง
🔑 การรวมกัน (ตัวอย่างการตั้งค่า)
- เริ่มช่วงเวลานิวยอร์ก:
-
- วาด OHLC รายวัน.
- จดจำ เปิดเที่ยงคืน NY.
- เฝ้าดูระดับ Gann ใกล้เคียง
- รอ การจับสภาพคล่อง (บุกจุดสูง/ต่ำรายวันหรือ Gann SR)
- ตรวจสอบ Triple-M / ZigZag #2 เพื่อยืนยันขาขึ้น/ขาลงเล็กๆ
- เข้าเทรดโดยตั้งจุดหยุดหลังการกวาดสภาพคล่อง
- ตั้งเป้าหมายที่ฝั่งตรงข้ามของช่วงราคาหรือระดับ Gann/HTF ถัดไป
✅ โดยสรุป:
- OHLC รายวัน + เที่ยงคืน NY = ตัวกรองอคติ
- ZigZag + Triple-M = จังหวะเข้าเทรด
- Gann + คู่มือช่วงราคา = เป้าหมายกำไร & สัญญาณการขยายตัว
อินดิเคเตอร์นี้โดยพื้นฐานให้คุณ เครื่องมือสไตล์ ICT ทั้งหมดในชุดเดียว สำหรับ XAU/USD
ถ้าคุณมีคำถามหรือพบปัญหาใด ๆ โปรดติดต่อผมได้เลย ผมยินดีช่วยเหลือคุณ!
ข้อจำกัดความรับผิดชอบ:
โดยการใช้สูตรของผม คุณรับทราบว่าการเทรดมีความเสี่ยงในตัวเองและผลลัพธ์ในอดีตไม่ได้รับประกันผลลัพธ์ในอนาคต สิ่งสำคัญคือคุณต้องมีแผนการบริหารความเสี่ยงที่มั่นคงและเหนือสิ่งอื่นใดคือต้องมีวินัยในการยึดมั่นกับระดับหยุดขาดทุน การไม่บริหารความเสี่ยงอย่างถูกต้องอาจนำไปสู่การขาดทุนอย่างมาก ผมไม่รับผิดชอบต่อผลลัพธ์ทางการเงินใด ๆ ที่เกิดจากการใช้สูตรเหล่านี้ โปรดเทรดอย่างรับผิดชอบและปฏิบัติตามหลักการบริหารความเสี่ยงอย่างเคร่งครัดเสมอ
ขอให้โชคดี! 🙌
สรุป
รีวิวจากลูกค้า
5 | 100 % | |
4 | 0 % | |
3 | 0 % | |
2 | 0 % | |
1 | 0 % |


