present
Sign up and get $50 off your first purchase
Trading product for XOChart Indicator Prop Forex, image 1
XOChart
Indicator
Version 1.0, Dec 2025
Windows, Mac
Since 23/12/2025

Description

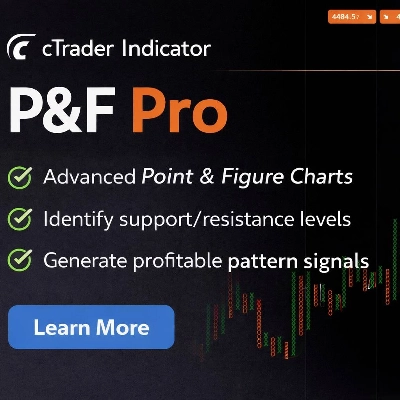
Point and figure charting enables easy identification of patterns like double tops and bottoms, triple tops and bottoms. Note that this is an experimental indicator in development. We will be updating the indicator and improving its functionality. Thank you for supporting the developer.

Summary

AI summary
XOChart is a point and figure charting indicator designed to facilitate the identification of chart patterns such as double tops and bottoms, as well as triple tops and bottoms. It supports analysis across multiple markets including forex, stocks, indices, commodities, and cryptocurrencies. The indicator is intended to assist traders in recognizing breakout signals and entry points by visually representing price movements without time as a factor. XOChart is categorized under market and strategy tools, with applicability for proprietary trading and various asset classes.
Indicator profile

Customer reviews

0.0
Reviews: 0
Customer reviews
No reviews for this product yet. Already tried it? Be the first to tell others!

Discussion

FAQ

Prop
Forex
Signal
Breakout
Indices
Commodities
Crypto
Stocks
Products available through cTrader Store, including trading bots, indicators and plugins, are provided by third-party developers and made available for informational and technical access purposes only. cTrader Store is not a broker and does not provide investment advice, personal recommendations or any guarantee of future performance.

You may also like

Indicator
ADX
ATR
+5
EMA-cross signals scored on six confluence layers, with an ATR stop, three targets and a live panel
Indicator
ATR
EMA
+4
Range-filter BUY/SELL signals scored by four confluence layers, with a stop, five targets and a trend panel
Indicator
Breakout
Institutional Flow Radar scans the chart for abnormal volume events and classifies them into two groups: Capital &Public
Indicator
EMA
Supertrend
+4
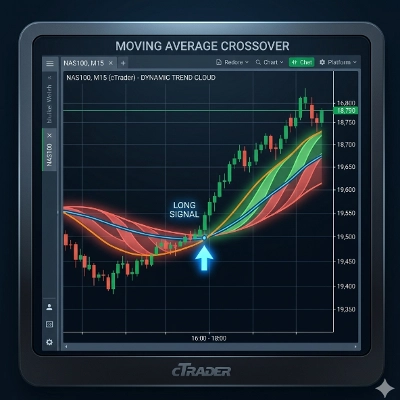
Dynamic dual MA cloud indicator. Identifies trends, crossovers, and pullback entries in real time for any asset.
Indicator
ATR
RSI
+5
Delta RSI Candle Pro, the indicator that transforms ordinary candlesticks into powerful momentum visualizers.
Indicator
ATR
RSI
+8
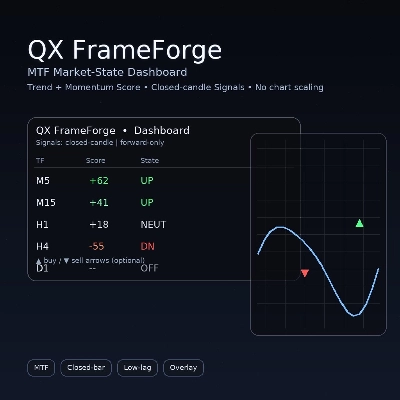
Multi-timeframe market-state dashboard: Score (-100..+100) + UP/NEUT/DN per TF, with optional closed-candle arrows.
Indicator
Volume
Liquidity Sweep
+1
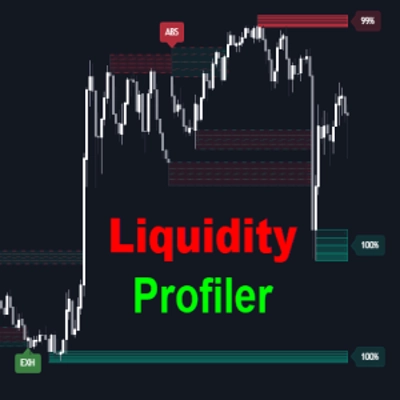
Liquidity Profiler Tools
Indicator
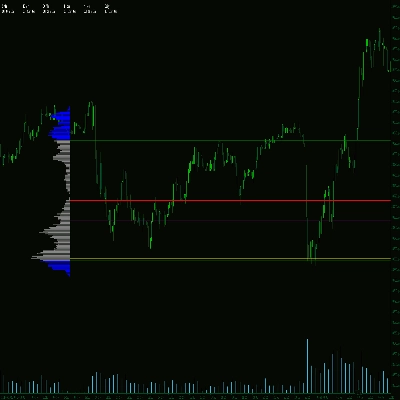
The Advanced Volume Profile Indicator calculates POC, Median, and Mode, revealing key price levels for smarter trading.
Indicator
SMC
Prop
+4
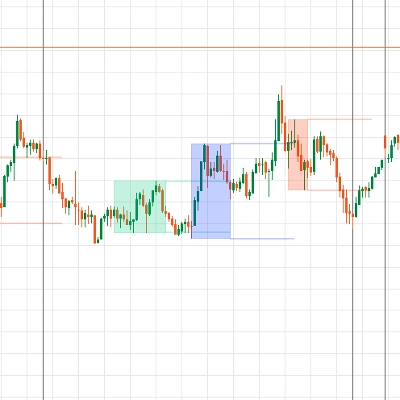
📈 Trading Sessions Indicator — London, New York & Tokyo Visualize Key Market Sessions + High/Low Levels with Precision
Indicator
Forex
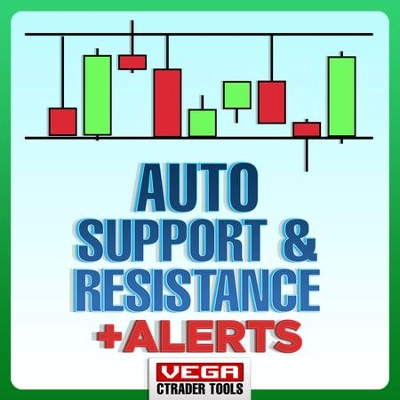
cTrader Auto Support & Resistance detects key levels with Fibonacci analysis and sends real-time trading alerts.
Indicator
Grid
Prop
+14
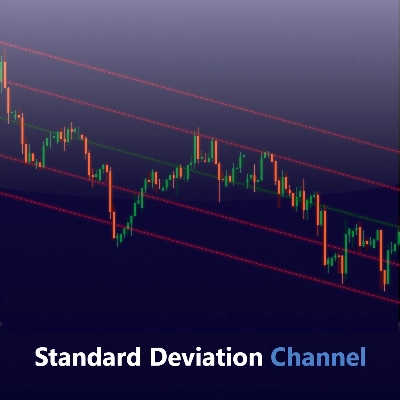
Visualize trends with Standard Deviation Channel! Display median, and add customizable upper/lower deviation channels.
Indicator
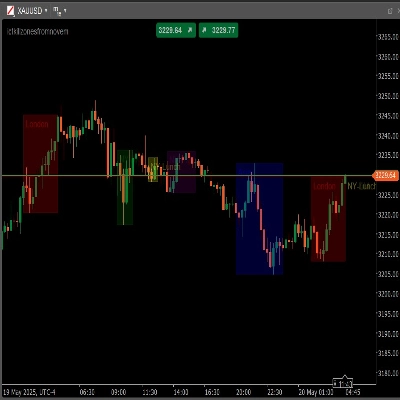
ICT ALL KİLL ZONES, LONDON , ASİA, NY AM, NY LUNCH, NY PM
Indicator
ADX
ATR
+5
Ten confluence layers scored on every closed bar, with an anti-chop gate, pivot levels and a live dashboard.
Indicator
SMC
Forex
+5
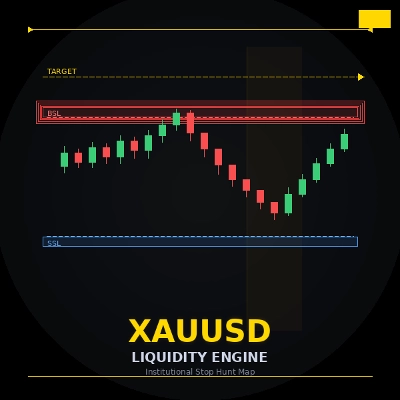
ICT liquidity engine for Gold: maps stop clusters, scores zones & projects the next target. Now with 4 ICT killzones.
Indicator
RSI
RSI on the main chart with 45/55 momentum levels, overbought/oversold levels, averaged RSI, and multi-timeframe support.
Indicator
Imbalance
Fair Value Gap
+1
Multi-symbol, multi-timeframe Fair Value Gaps in one panel.
Indicator
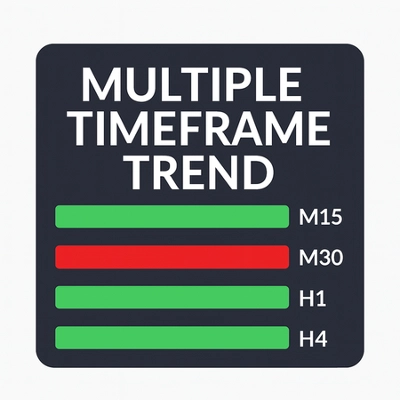
A compact, visual multi-timeframe trend indicator for cTrader. Easily spot bullish or bearish trends across 4 customizab
"rvwap v1" logo
Top-rated
4.6
(5)
$19
Indicator
Prop
VWAP
+13
Rolling VWAP with dynamic or fixed time window, customizable source price and standard deviation bands.

Price

Since 23/12/2025