present
Registrieren Sie sich und erhalten Sie $50 Rabatt auf Ihren ersten Kauf
Trading product for HIO Mutil Currency Stochastic Scanner Indikator Volume Stochastic, image 1
HIO Mutil Currency Stochastic Scanner
Indikator
Version 1.1, May 2026
Windows, Mac
4.5
Bewertungen: 4
Trading product for HIO Mutil Currency Stochastic Scanner Indikator Volume Stochastic, image 2
Trading product for HIO Mutil Currency Stochastic Scanner Indikator Volume Stochastic, image 3
Trading product for HIO Mutil Currency Stochastic Scanner Indikator Volume Stochastic, image 4
Trading product for HIO Mutil Currency Stochastic Scanner Indikator Volume Stochastic, image 5
Trading product for HIO Mutil Currency Stochastic Scanner Indikator Volume Stochastic, image 6
Seit 12/06/2025
1
Verkäufe
399
Kostenlose Installationen

Beschreibung

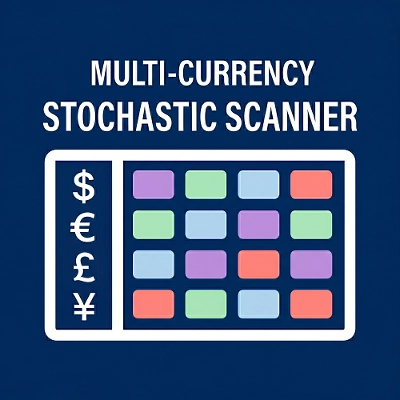
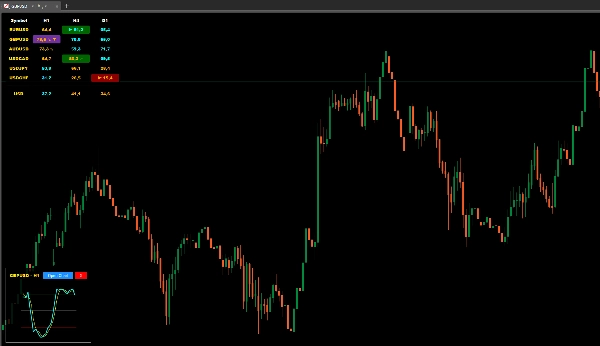
Der HIO Multi-Currency Stochastic Scanner ist ein fortschrittlicher Dashboard-Indikator, der entwickelt wurde, um Ihre Marktanalyse zu vereinfachen. Anstatt dutzende Charts zu öffnen, ermöglicht Ihnen dieses Tool, den Stochastik-Oszillator über mehrere Symbole und Zeitrahmen gleichzeitig von einem einzigen Panel aus zu überwachen. Es unterstützt Trader dabei, potenzielle Marktbedingungen effizient zu identifizieren, spart Zeit und hält Ihren Arbeitsbereich organisiert.

Hauptmerkmale

  • Multi-Symbol- & Zeitrahmen-Überwachung: Verfolgen Sie bis zu dutzende Währungspaare über Ihre gewählten Zeitrahmen in einem übersichtlichen Raster.
  • Interaktive Mini-Charts: Klicken Sie auf eine beliebige Zelle, um ein Pop-up-Mini-Chart zu öffnen, das Ihnen ermöglicht, die Stochastik-Linien und K/D-Kreuzungen sofort zu visualisieren, ohne Ihr aktuelles Chart zu verlassen.
  • Währungsstärke-Messgerät: Verfügt über eine eigene Zeile zur Berechnung der gewichteten Stärke einer Zielwährung (z. B. USD) basierend auf Stochastik- und Volumendaten.
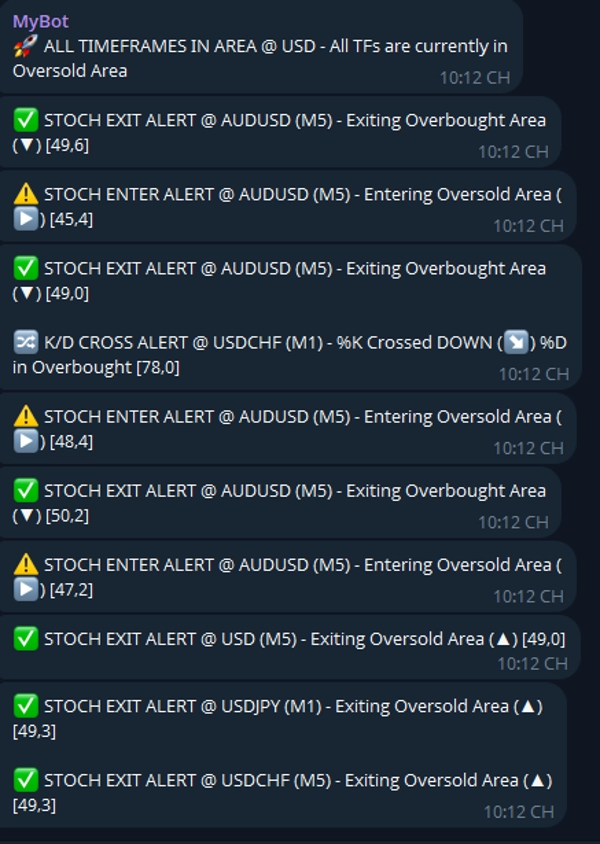
  • Umfassende Benachrichtigungen: Unterstützt Telegram-Benachrichtigungen für das Betreten/Verlassen von Überkauft- (OB) und Überverkauft-Bereichen (OS) sowie K/D-Kreuzungen.
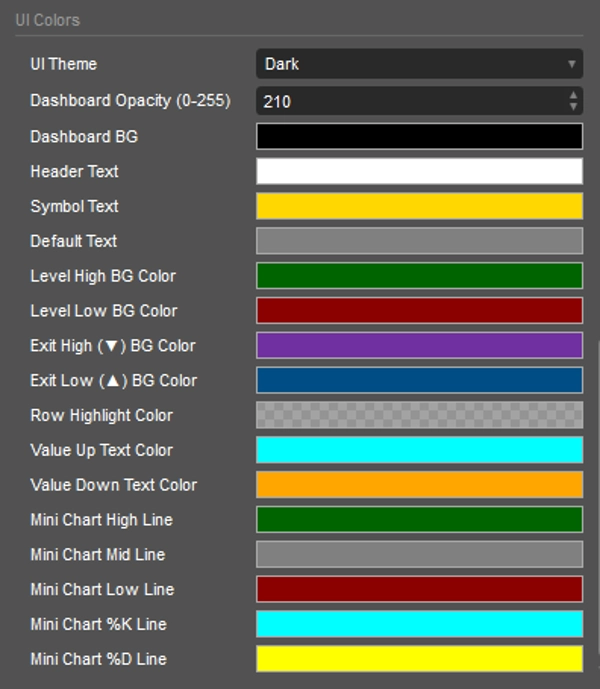
  • Anpassbare Benutzeroberfläche: Wählen Sie zwischen Dunkel-, Hell- oder benutzerdefinierten Themen. Schalten Sie die Dashboard-Sichtbarkeit sofort mit einer Hotkey um.

Einrichtung & Parameter

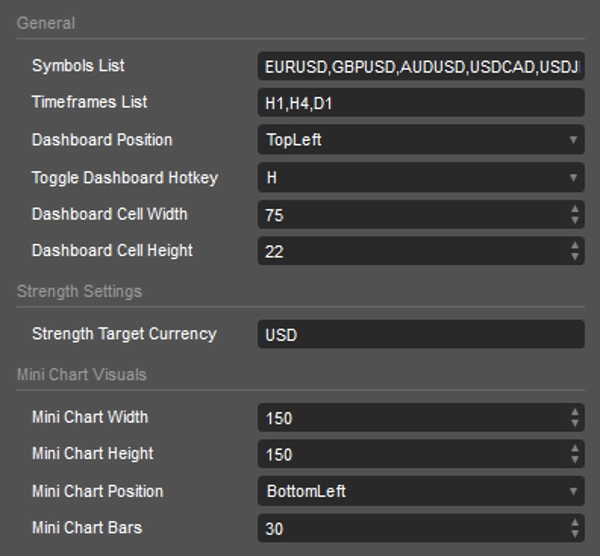
  • Allgemein: Definieren Sie Ihre Symbols List (durch Kommas getrennt) und Timeframes List. Legen Sie die Toggle Dashboard Hotkey fest (Standard ist 'H').
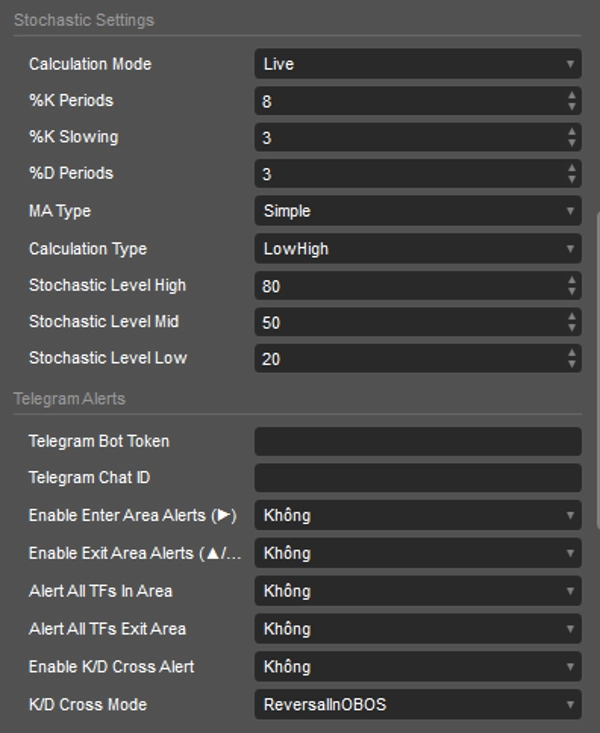
  • Stochastik-Einstellungen: Passen Sie vollständig die %K Periods, %K Slowing, %D Periods und MA Type an, um Ihre Strategie anzupassen. Passen Sie OB/OS-Grenzen über Stochastic Level High und Stochastic Level Low an.
  • Telegram-Benachrichtigungen: Geben Sie Ihren Telegram Bot Token und Chat ID ein. Aktivieren Sie spezifische Alarmauslöser wie Bereich Betreten/Verlassen oder K/D-Kreuzungsmodus (Umkehr, Fortsetzung, Neutralzone usw.).

Symbole & Farberklärung

  • Farben:
    • Dunkelgrüner Hintergrund: Symbol befindet sich im Überkauften Bereich.
    • Dunkelroter Hintergrund: Symbol befindet sich im Überverkauften Bereich.
    • Aqua / Orangefarbener Text: Zeigt an, ob der Stochastik-Wert derzeit steigt (Aqua) oder fällt (Orange).
  • Symbole:
    • ▶ (Betreten): Der Preis betritt die Überkauft- oder Überverkauft-Zone.
    • ▲ (Verlassen Tief): Der Preis verlässt die Überverkauft-Zone nach oben.
    • ▼ (Verlassen Hoch): Der Preis verlässt die Überkauft-Zone nach unten.
    • ↗ (Kreuz Aufwärts): Die %K-Linie hat die %D-Linie nach oben gekreuzt.
    • ↘ (Kreuz Abwärts): Die %K-Linie hat die %D-Linie nach unten gekreuzt.

Der HIO Multi-Currency Stochastic Scanner ist ein robustes Workflow-Verbesserungstool für technische Trader. Durch die Zentralisierung wichtiger Momentum-Daten bietet er eine klarere makroökonomische Perspektive des Marktes und hilft Ihnen, fundierte Entscheidungen ohne Chart-Unordnung zu treffen.

Zusammenfassung

KI-Zusammenfassung
The HIO Multi-Currency Stochastic Scanner is a technical indicator designed for monitoring the Stochastic Oscillator across multiple currency pairs and timeframes within a single dashboard. It enables traders to track dozens of symbols simultaneously, providing a consolidated view of momentum conditions without opening multiple charts. Key features include interactive mini-charts accessible via dashboard cells for quick visualization of Stochastic lines and K/D crossovers, a currency strength meter that calculates weighted strength based on Stochastic and volume data, and customizable alerts sent through Telegram for entering or exiting overbought/oversold zones and K/D cross events. The user interface supports dark, light, and custom themes, with a hotkey toggle for dashboard visibility. Users can define symbol and timeframe lists, adjust Stochastic parameters (%K periods, slowing, %D periods, MA type), and set overbought/oversold thresholds. Color-coded backgrounds and symbols indicate market conditions such as overbought (dark green), oversold (dark red), rising or falling Stochastic values, and specific price zone entries or exits. This tool centralizes momentum data to enhance workflow efficiency and provide a clearer macro perspective for technical analysis in forex markets.
Indikatorprofil
Indikatorkategorie
Momentum
Ausgabetyp
Visualisierung
Signale
Filter
Datenanforderungen
Nur Balken
Tick-Daten
Volumen
Unterstützte Signale
Durchbrechen
Wendepunkt
Volatilität
Trendstärke
Abweichung
Level – Durchbrechen
Level – Berührung

Kundenbewertungen

4.5
Bewertungen: 4
5
50 %
4
50 %
3
0 %
2
0 %
1
0 %
Kundenbewertungen
May 23, 2026
The review feels less uncertain, but it works better with a written plan.
May 20, 2026
a calm trader gets value from timing feels less random, and two sessions say more than one clean chart.
May 17, 2026
25 signals is a fair first sample. The click feels less automatic.
May 17, 2026
A 5 minute check should not become a 30 minute rabbit hole. It supports the idea without replacing judgment.

Diskussion

Häufig gestellte Fragen (FAQ)

Volume
Stochastic
Über den cTrader Store verfügbare Produkte, einschließlich Handelsbots, Indikatoren und Plugins, werden von externen Entwicklern bereitgestellt und nur zu Informations- und technischen Zugriffszwecken verfügbar gemacht. cTrader Store ist kein Broker und erbringt keine Anlageberatung, persönlichen Empfehlungen oder eine Garantie für zukünftige Performance.

Mehr von diesem Autor

Indikator
Forex
BTCUSD
+9
On-chart economic calendar with custom filters and automated Telegram alerts. Never miss high-impact news!
Indikator
Forex
BTCUSD
+13
Multi-symbol Inside Bar Scanner with dashboard & breakout alerts
Indikator
Forex
BTCUSD
+10
(ViPi) MTF Candle displays multiple higher timeframe candles right on your current chart for ultimate trend analysis.
Indikator
Prop
Forex
+14
Pro Inside Bar Scanner with smart Telegram alerts & multi-timeframe dashboard
Indikator
RSI
Volume
Scan RSI across multiple timeframes/symbols with real-time Telegram alerts and interactive visual mini-charts.
Indikator
CCI
Volume
Monitor multiple pairs and timeframes with this interactive CCI dashboard. Includes mini-charts & Alerts.
Indikator
Key Levels
Display live economic events directly on your chart with impact filters and automated advance notifications.

Das könnte Sie auch noch interessieren

Indikator
Forex
GBPUSD
+3
Support & resistance zones with measured hold rates and confidence intervals — evidence, not just lines on a chart.
Indikator
Prop
Forex
+4
Fractals is a precision-engineered trading indicator for cTrader that reveals the hidden architecture of price action.
Indikator
RSI
SMC
+17
RSI, MACD, Stochastic, CCI & Momentum divergence scanner with confluence scoring. Never miss a signal again!
Indikator
The Multi-Timeframe Candle Indicator displays candles from multiple timeframes in one window, enhancing market analysis!
Indikator
Pin Bar
Inside Bar
+2
Advanced candlestick pattern recognition with structural quality scoring, alerts and adaptive chart visuals.
Indikator
ATR
RSI
+17
Turn data into precision trades with AlphaTrend Pro Max — advanced trend, signal & structure analysis in one.
„Vwap Bands“-Logo
Beste Ratings
4.5
(4)
$19
/
$29
Indikator
VWAP
Moving Average
Vwap Bands it is highly sought after by professional traders because it includes Standard Deviation Bands
Indikator
Volume
Channel
+5
Spots volatility squeezes before they fire — the compression phase everyone else misses.
Indikator
BOS
Volume
+5
20/40/60-day IPDA lookback ranges, Premium/Discount/Equilibrium zones, and quarterly shift alerts — anchored to true dai
Indikator
BOS
Key Levels
+1
Guided by Yahuah Yahusha. 15M: BOS above red (buys)/below green (sells). 4HC reject+BOS. 5M: RBS/SBR. SL wick. TP 1:4.
Indikator
Forex
EURUSD
+4
A precision overlay tool that combines session-aware VWAP logic and standard deviations.
„UT Bot“-Logo
Beliebt
4.4
(5)
$19
/
$20
Indikator
ATR
Forex
+11
Trend-following indicator with dynamic ATR-based trailing stop for precise entry/exit signals
Indikator
CandleCounterAlex – Candle Cycle Counter with Colors and Adjustable Position.
Indikator
Support & Resistance
Detects Gartley, Bat, Butterfly, Crab, Shark & Cypher patterns and backtests each one's real win rate.
Indikator
RSI
VegaXLR's cTrader StochRSI identifies overbought/oversold RSI levels for precise trade entries.
Indikator
Prop
Forex
+10
IBS Indicator – Measures price position within bars for smarter trades. Works on all markets & timeframes.
Indikator
AI
Prop
+9
Phoenix Zones - Detector de Reversiones Críticas
Indikator
Indices
Custom ADX Indicator for precise trend analysis. المؤشر المخصص ADX لتحليل الاتجاه بدقة

Preis

Seit 12/06/2025
1
Verkäufe
399
Kostenlose Installationen