
3 Bar Triangle by Linda Raschke
อินดิเคเตอร์
536 ดาวน์โหลด
เวอร์ชัน 1.0, Sep 2024
Windows, Mac
5.0
รีวิว: 1
คำอธิบาย
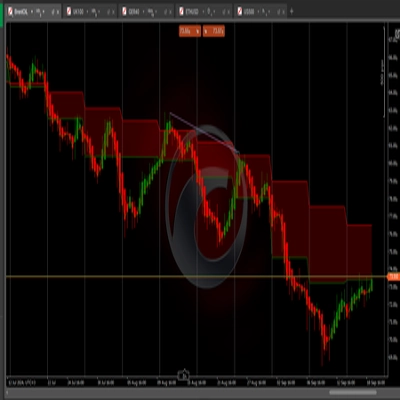
รูปแบบนี้แสดงถึง การรวมตัว หรือ การบีบตัวของราคา ซึ่งราคากำลังหดตัวอยู่ในช่วงที่แคบลง ตลาดกำลัง "ขดตัว" เพื่อเตรียมพร้อมสำหรับการเบรกเอาต์ในทิศทางใดทิศทางหนึ่ง โดยปกติจะนำไปสู่การเคลื่อนไหวที่รุนแรงเมื่อราคาทะลุออกจากรูปสามเหลี่ยม
การเทรดเบรกเอาต์:
- การเข้าเทรด: เทรดเดอร์จะมองหาการเบรกเอาต์เหนือจุดสูงสุดของรูปแบบหรือใต้จุดต่ำสุดของรูปแบบ เพื่อบ่งชี้ทิศทางของการเคลื่อนไหวครั้งถัดไป
- จุดหยุดขาดทุน: การวางจุดหยุดขาดทุนไว้ด้านนอกของด้านตรงข้ามของรูปสามเหลี่ยม (ไม่ว่าจะเหนือจุดสูงสุดหรือใต้จุดต่ำสุด) ช่วยในการจัดการความเสี่ยง
- เป้าหมาย: เทรดเดอร์บางรายตั้งเป้าหมายการเคลื่อนไหวของราคาที่เท่ากับขนาดของรูปสามเหลี่ยม (ระยะห่างระหว่างจุดสูงสุดและต่ำสุดของแท่งแรก)
สรุป
สรุปโดย AI
The 3 Bar Triangle indicator by Linda Raschke identifies a consolidation pattern where price contracts within a narrowing range, forming a "triangle" shape over three bars. This pattern signals market "coiling," indicating potential for a sharp breakout in either direction once price moves beyond the triangle boundaries. Traders use this indicator to time entries by watching for a breakout above the pattern’s high or below its low, which suggests the direction of the next price move. Risk management involves placing stop-loss orders just outside the opposite side of the triangle to limit potential losses. Profit targets are often set based on the size of the triangle, aiming for a price movement equal to the distance between the high and low of the initial bar. This indicator supports breakout trading strategies by highlighting periods of price squeezing and potential volatility expansion.
โปรไฟล์อินดิเคเตอร์
รีวิวจากลูกค้า
5.0
รีวิว: 1
5 | 100 % | |
4 | 0 % | |
3 | 0 % | |
2 | 0 % | |
1 | 0 % |
รีวิวจากลูกค้า
August 12, 2025
Pros: Identifies classic 3-bar triangle consolidation zones. Simple setup, visually clear. Stable across timeframes. Cons: No alerts or tooltips. Lacks volume filters and signal confirmation. Limited customization
การสนทนา
คำถามที่พบบ่อย
Breakout
ผลิตภัณฑ์ที่มีให้บริการผ่าน cTrader Store รวมถึงบอทการเทรด อินดิเคเตอร์ และปลั๊กอิน มีให้บริการโดยนักพัฒนาบุคคลที่สามและมีไว้เพื่อวัตถุประสงค์ในการเข้าถึงข้อมูลและทางเทคนิคเท่านั้น cTrader Store ไม่ใช่โบรกเกอร์และไม่ได้ให้คำแนะนำการลงทุน คำแนะนำส่วนบุคคล หรือการรับประกันผลการดำเนินงานในอนาคต
เพิ่มเติมจากผู้เขียนคนนี้


ราคา
ตั้งแต่ 19/09/2024
314.61K
ปริมาณการเทรด
258.47K
Pips ที่ได้กำไร
536
ติดตั้งฟรี