
คำอธิบาย
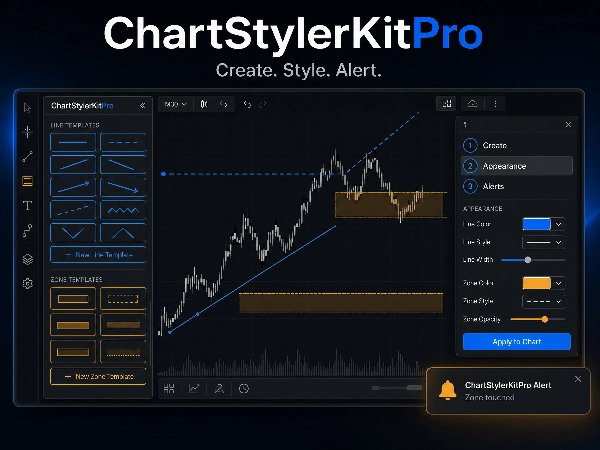
ChartStyleKitPro เป็นตัวบ่งชี้ cTrader ที่ออกแบบมาเป็นแผงควบคุมศูนย์กลางสำหรับการจัดการ การจัดรูปแบบ และการจัดระเบียบวัตถุกราฟิก (สี่เหลี่ยมผืนผ้าและเส้นแนวโน้ม) จุดประสงค์คือเพื่อขจัดงานที่ต้องทำด้วยมือและซ้ำซ้อนในการจัดรูปแบบแต่ละภาพวาดบนแผนภูมิ โดยมีการดำเนินการจำนวนมาก เทมเพลตที่นำกลับมาใช้ใหม่ได้ และข้อความอัตโนมัติอัจฉริยะ
ตัวบ่งชี้ทำงานเป็นเลเยอร์ซ้อนทับ: มันไม่สร้างสัญญาณหรือคำนวณตัวบ่งชี้ทางเทคนิค คุณค่าของมันอยู่ที่ประสิทธิภาพการทำงานและความสอดคล้องทางสายตาของการวิเคราะห์แผนภูมิ
คุณสมบัติหลัก
1. แผงควบคุมแบบโต้ตอบ
สร้างเทมเพลตที่ตั้งชื่อไว้
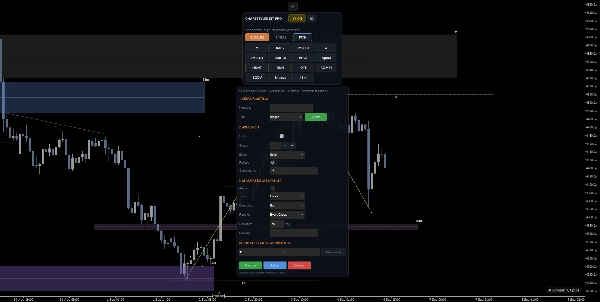
เปิดไอคอนรูปเฟืองและค้นหา 1. CREATE TEMPLATE. ในส่วนนี้ พิมพ์ชื่อเริ่มต้นของเทมเพลต เลือก Block หรือ Line แล้วคลิก Create. เทมเพลตจะได้รับชื่อตั้งแต่ขั้นตอนแรกนี้
เทมเพลตใหม่เริ่มต้นด้วยค่าที่ปลอดภัยและแก้ไขได้: สีพื้นฐาน ความหนา สไตล์ทึบ การเติมตามประเภท และการแจ้งเตือนถูกปิดใช้งาน การสร้างจะไม่วาดวัตถุโดยอัตโนมัติ แต่จะลงทะเบียนเทมเพลตก่อนเพื่อให้สามารถตรวจสอบและใช้งานจากกริดได้
2. กำหนดลักษณะรูปลักษณ์
เลือกคุณสมบัติภาพที่คุณต้องการนำกลับมาใช้ใหม่ คลิก Save เพื่อบันทึกการเปลี่ยนแปลง
3. เส้น 50% อัตโนมัติ
สำหรับสี่เหลี่ยมผืนผ้าที่วาดแต่ละอัน ตัวบ่งชี้จะคำนวณและวาดเส้นแนวนอนที่จุดกึ่งกลาง (50%) ระหว่างราคาสูงสุดและต่ำสุดของสี่เหลี่ยมผืนผ้า
- เส้นเป็นเส้นประโดยค่าเริ่มต้น (ปรับแต่งได้)
- มีป้ายกำกับ "50%" ที่ขอบด้านซ้าย
- อัปเดตแบบเรียลไทม์หากคุณย้ายหรือปรับขนาดสี่เหลี่ยมผืนผ้า
- ซ่อน/แสดงพร้อมกับสี่เหลี่ยมผืนผ้าหลัก (ทำงานเหมือนวัตถุเดียว)
การใช้งานทั่วไป: โซนสมดุลภายในช่วงราคาหนึ่ง ระดับการตัดสินใจภายในโซนอุปทาน/อุปสงค์
3. Automatic 50% line
สำหรับสี่เหลี่ยมผืนผ้าที่วาดแต่ละอัน ตัวบ่งชี้จะคำนวณและวาดเส้นแนวนอนที่จุดกึ่งกลาง (50%) ระหว่างราคาสูงสุดและต่ำสุดของสี่เหลี่ยมผืนผ้าโดยอัตโนมัติ
- เส้นเป็นเส้นประโดยค่าเริ่มต้น (ปรับแต่งได้)
- มีป้ายกำกับ "50%" ที่ขอบด้านซ้าย
- อัปเดตแบบเรียลไทม์หากคุณย้ายหรือปรับขนาดสี่เหลี่ยมผืนผ้า
- ซ่อน/แสดงพร้อมกับสี่เหลี่ยมผืนผ้าหลัก (ทำงานเหมือนวัตถุเดียว)
- การใช้งานทั่วไป: โซนสมดุลภายในช่วงราคาหนึ่ง ระดับการตัดสินใจภายในโซนอุปทาน/อุปสงค์
4. ข้อความอัตโนมัติในสี่เหลี่ยมผืนผ้า
ถ้าสี่เหลี่ยมผืนผ้ามี ความคิดเห็น ตัวบ่งชี้จะแสดงเป็นข้อความที่มองเห็นได้ภายในสี่เหลี่ยมผืนผ้า
- ตำแหน่งคำนวณโดยอัตโนมัติ: มุมบนขวาพร้อมระยะขอบที่ปรับแต่งได้
- ระยะขอบแนวตั้งเป็นพิปส์ (จากขอบบน)
- ระยะขอบแนวนอนเป็นชั่วโมง (จากขอบขวา)
- ขนาดตัวอักษรปรับได้ตามขนาดหน้าต่าง
- สี ตัวหนา และแบบอักษรปรับแต่งได้
- การใช้งานทั่วไป: ป้ายเช่น "Supply Zone", "Buy Zone", "FVG", "Order Block" แสดงโดยตรงบนโซนโดยไม่ต้องใช้ข้อความเพิ่มเติมด้วยมือ
5. เทมเพลตสไตล์
ระบบ CRUD ครบถ้วน (สร้าง อ่าน อัปเดต ลบ) สำหรับการบันทึกและนำกลับมาใช้ใหม่ของการกำหนดค่าภาพของวัตถุ
สิ่งที่แต่ละเทมเพลตบันทึก:
- สี
- ความหนา
- สไตล์เส้น (ทึบ, ประ, ฯลฯ)
- การเติม (สำหรับสี่เหลี่ยมผืนผ้า)
- สถานะการมองเห็น
- สถานะล็อก
- ความคิดเห็น
การดำเนินการที่มี:
คำอธิบายการดำเนินการ
บันทึก
ดึงสไตล์จากวัตถุที่เลือกและบันทึกด้วยชื่อที่กำหนดเอง รวมถึงช่องความคิดเห็นที่เป็นทางเลือก
ใช้
โหลดเทมเพลตที่บันทึกไว้และใช้กับวัตถุที่เลือกทั้งหมด
อัปเดต
เขียนทับเทมเพลตที่มีอยู่ด้วยสไตล์ปัจจุบันของวัตถุที่เลือก
เปลี่ยนชื่อ
เปลี่ยนชื่อเทมเพลตที่มีอยู่
ลบ
ลบเทมเพลตออกจากที่เก็บ
โทนอุ่น ลดความเมื่อยล้าของดวงตาในระหว่างเซสชันยาว
สีเน้นสามารถปรับแต่งได้ (ค่าเริ่มต้นเป็นสีน้ำเงิน #4DA6FF) ปุ่มสลับจะคำนวณสีที่ใช้งาน/ไม่ใช้งานโดยอัตโนมัติด้วยความคมชัดที่ดีรับประกัน
สรุป
Key features include:
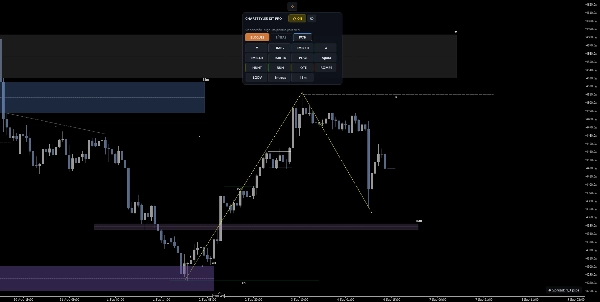
- Interactive control panel: When selecting graphical objects, a floating panel appears showing the count and type of selected items, with buttons to lock/unlock, hide/show, toggle fill for rectangles, hide/show all objects, and manage style templates. Contextual help guides available actions.
- Automatic 50% line: For each rectangle, the indicator draws a horizontal line at the midpoint between its top and bottom prices, updating in real time with movement or resizing. This line includes a "50%" label and hides/shows with its parent rectangle.
- Automatic text rendering: Comments attached to rectangles or trend lines are displayed as text within or above the objects, with configurable position, margins, font size, and style.
- Style templates: A full CRUD system allows saving, applying, updating, renaming, and deleting visual style templates that store color, thickness, line style, fill, visibility, lock state, and comments for objects.
- Four interface color themes: Dark, Light, Midnight, and Warm, each with configurable accent colors and automatic toggle button contrast.
This tool supports efficient management of chart annotations commonly used in market structure and Smart Money Concepts analysis, including supply/demand zones, order blocks, fair value gaps, and support/resistance levels.
รีวิวจากลูกค้า
การสนทนา
คำถามที่พบบ่อย


















ราคา
