
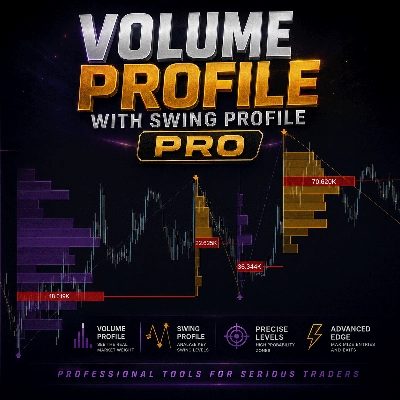
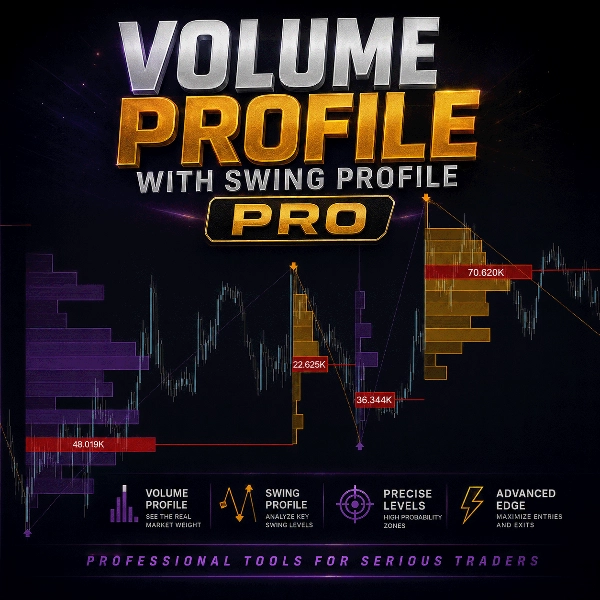
Swing Profile with Volume Profile PRO
Indicatore
Versione 1.0, Jul 2026
Windows, Mac

Da 02/06/2026
492
Installazioni gratuite
Descrizione
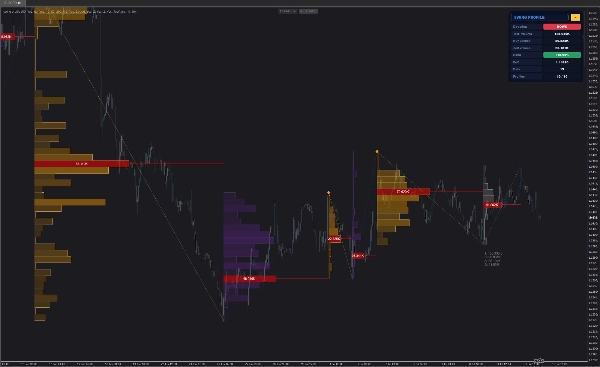
Profilo Swing — Struttura del Volume ad Ogni Svolta del Mercato
📊 Cosa fa
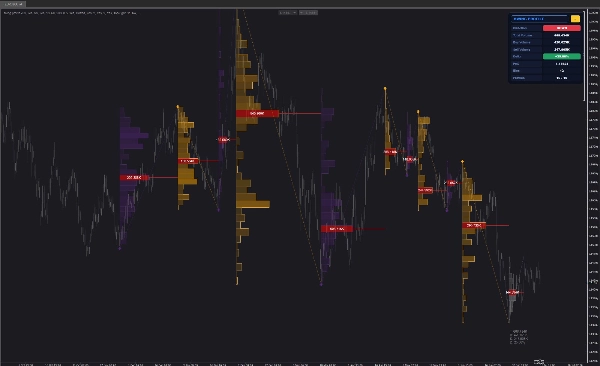
- Rileva automaticamente i massimi e minimi dello swing e costruisce un profilo di volume completo per ogni gamba di swing completata
- Mostra esattamente dove il volume è stato scambiato durante un movimento — non solo dove è andato il prezzo
- Nessun ancoraggio manuale, nessuna casella di sessione, nessun intervallo fisso. Segue la struttura del mercato
🎯 Punto di Controllo (PoC)
- Evidenzia il livello di prezzo con il volume più alto scambiato in ogni swing
- La linea PoC si estende lungo la gamba con un'etichetta di volume (es. 40.442K)
- I livelli PoC spesso agiscono come magneti, zone di retest e livelli di reazione
📈 Delta Acquisto / Vendita
- Ogni profilo divide il volume in pressione lato acquisto e lato vendita
- La percentuale di Delta mostra istantaneamente chi ha dominato lo swing
- Individua assorbimento, esaurimento e squilibrio nascosto prima che la inversione sia ovvia
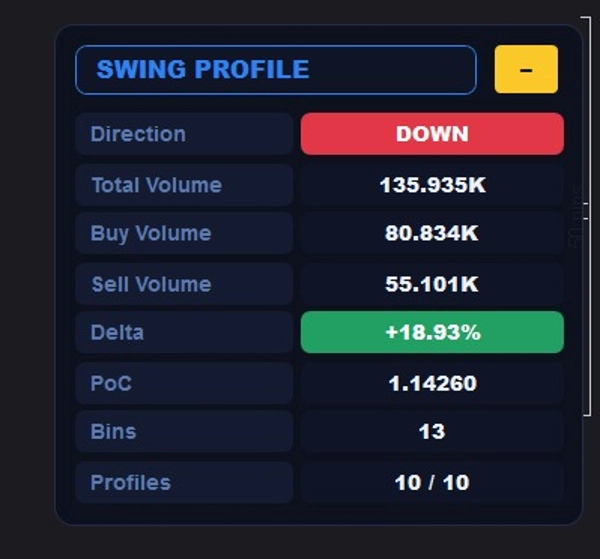
🖥️ Pannello Informazioni Collassabile
- Direzione dello swing in tempo reale (SU / GIÙ)
- Volume totale, volume acquisto, volume vendita
- Percentuale Delta con pillola colorata (verde / rosso)
- Prezzo PoC attivo, conteggio bin, profili sul grafico
- Collasso con un clic per mantenere il grafico pulito
⚡ Progettato per la Velocità
- Parametro Max Profiles — mostra solo gli ultimi N profili (default 10) così il grafico si carica istantaneamente, anche su M1
- Limite Max Bins Per Profile previene l'esplosione di oggetti su swing lunghi
- Ottimizzazione del binning del volume O(bars) invece di cicli annidati a forza bruta
- I profili vecchi vengono rimossi automaticamente man mano che nuovi swing si completano
🔧 Completamente Configurabile
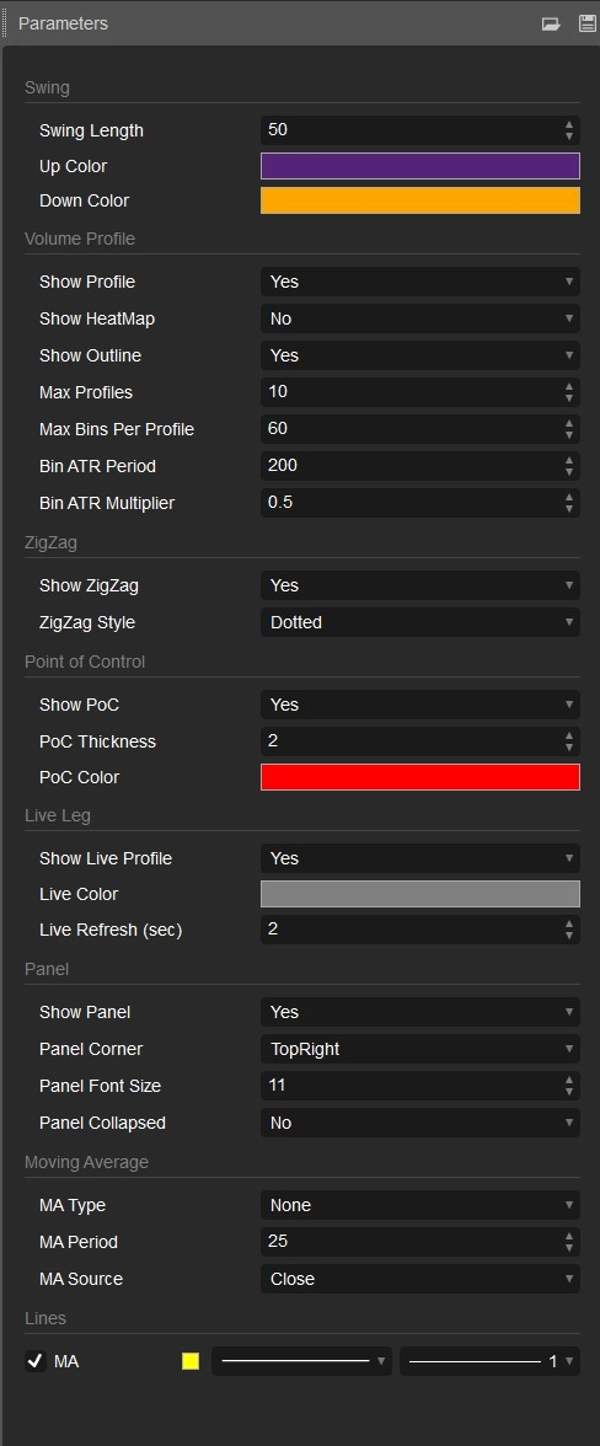
- Lunghezza Swing — controlla quanto aggressiva o fluida è la rilevazione della struttura
- Dimensione bin basata su ATR — i profili si adattano automaticamente a qualsiasi strumento (Oro, EURUSD, indici, crypto)
- Modalità profilo / modalità HeatMap / contorno on-off
- Sovrapposizione ZigZag: puntinata, tratteggiata o continua
- Selettori colore nativi cTrader per colori up, down, PoC e live
- Sovrapposizione media mobile opzionale (SMA / EMA / WMA / Wilder / Hull)
🔴 Gamba in Tempo Reale
- Lo swing attualmente in formazione è visualizzato in grigio neutro
- Volume live, delta e PoC si aggiornano mentre lo swing si sviluppa
- Intervallo di aggiornamento regolabile per mantenere basso l'uso della CPU
💡 Come lo usano i trader
- Trada i retest del PoC dopo che uno swing si completa
- Contrasta gli swing che mostrano delta negativo verso nuovi massimi (e viceversa)
- Usa nodi a basso volume come zone di movimento rapido e nodi ad alto volume come supporto/resistenza
- Combina con struttura SMC/ICT: PoC dentro un blocco d'ordine = confluenza ad alta probabilità
⚙️ Specifiche
- Timeframe: tutti
- Strumenti: tutti (normalizzati ATR)
- Fonte volume: volume tick (standard cTrader/broker per FX & metalli)
- Richiede cTrader Desktop 4.6+ (supporto selettore colore nativo)
Riepilogo
Riepilogo AI
Swing Profile with Volume Profile PRO is a volume-based trading indicator designed for use on all timeframes and instruments, including Forex, metals, indices, and cryptocurrencies. It automatically detects swing highs and lows, constructing a detailed volume profile for each completed swing leg without manual anchoring or fixed ranges, thus aligning with market structure.
Key features include the Point of Control (PoC), which highlights the price level with the highest traded volume per swing and often serves as a retest or reaction zone. The indicator also provides buy/sell delta data, splitting volume into buy-side and sell-side pressure to reveal market dominance, absorption, exhaustion, and hidden imbalances before reversals.
A collapsible info panel displays live swing direction, total and segmented volumes, delta percentage with color coding, active PoC price, and profile counts, allowing users to keep charts organized. The tool is optimized for speed with parameters to limit the number of profiles and bins, ensuring efficient performance even on minute charts.
Customization options include swing length sensitivity, ATR-based bin sizing, profile display modes, ZigZag overlay styles, native color pickers, and optional moving average overlays. The currently forming swing leg updates in real time with live volume, delta, and PoC data. Traders use this indicator to identify key volume levels, trade PoC retests, detect swing momentum shifts, and combine volume structure with market context for informed decision-making.
Key features include the Point of Control (PoC), which highlights the price level with the highest traded volume per swing and often serves as a retest or reaction zone. The indicator also provides buy/sell delta data, splitting volume into buy-side and sell-side pressure to reveal market dominance, absorption, exhaustion, and hidden imbalances before reversals.
A collapsible info panel displays live swing direction, total and segmented volumes, delta percentage with color coding, active PoC price, and profile counts, allowing users to keep charts organized. The tool is optimized for speed with parameters to limit the number of profiles and bins, ensuring efficient performance even on minute charts.
Customization options include swing length sensitivity, ATR-based bin sizing, profile display modes, ZigZag overlay styles, native color pickers, and optional moving average overlays. The currently forming swing leg updates in real time with live volume, delta, and PoC data. Traders use this indicator to identify key volume levels, trade PoC retests, detect swing momentum shifts, and combine volume structure with market context for informed decision-making.
Profilo indicatore
Categoria indicatore
Volume
Tipo di output
Visualizzazione
Segnali
Requisiti per i dati
Solo barre
Volume
Segnali supportati
Inversione
Forza del trend
Volatilità
Divergenza
Discussioni
Recensioni dei clienti
0.0
Recensioni: 0
Recensioni dei clienti
Questo prodotto non ha ancora ricevuto recensioni. L'hai già provato? Fallo sapere agli altri per primo!
Domande frequenti
Key Levels
Imbalance
Volume
Market Structure
Channel
VWAP
Support & Resistance
I prodotti disponibili tramite cTrader Store, inclusi bot di trading, indicatori e plugin, sono forniti da sviluppatori terzi e resi disponibili esclusivamente a scopo informativo e di accesso tecnico. cTrader Store non è un broker e non fornisce consulenze in materia di investimento, raccomandazioni individualizzate o garanzie di risultati futuri.
Altro da questo autore

















Prezzo
Da 02/06/2026
492
Installazioni gratuite