NNFX TP AND SL V1.1
Indicatore
Versione 1.0, Apr 2025
Windows, Mac
5.0
Recensioni: 1

Descrizione
🔹 Cosa Fa
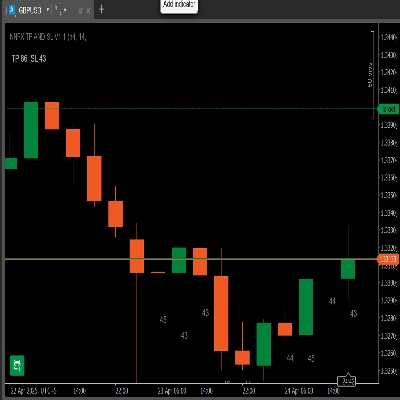
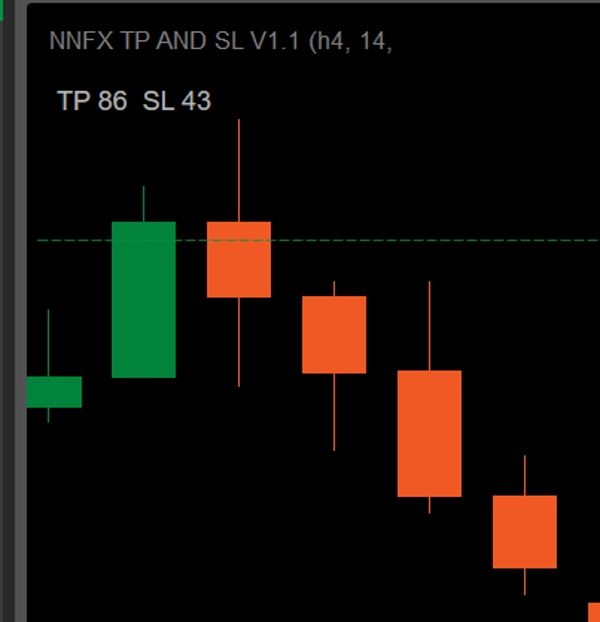
- Pannello Dinamico: Mostra “TP × SL” in pips basato sul periodo ATR scelto e sul moltiplicatore TP.
- Etichette ATR degli ultimi 10 Bar: Stampa l’ATR in pips sotto ciascuna delle ultime 10 candele (sullo stesso timeframe).
- Controllo del Timeframe: Se lo applichi su un timeframe diverso, avvisa “I timeframe non corrispondono – ATR non mostrato sui bar.”
🔹 Caratteristiche Principali
- Visualizzazione del Pannello
-
- TP = ATR × il tuo Moltiplicatore (scegli da 1 a 4.5 con incrementi di 0.5)
- SL = ATR in pips
- Esempio: ATR = 43 → SL = 43 pips. Se Moltiplicatore = 2 → TP = 86 pips.
- Etichette ATR per Bar
-
- Sovrapponi gli ultimi 10 bar con i loro valori ATR in pips.
- Ti mantiene immediatamente consapevole della volatilità recente.
- Validazione del Timeframe
-
- Disegna le etichette solo quando il timeframe del grafico corrisponde all’impostazione del timeframe ATR.
- Altrimenti appare un avviso rosso in basso.
- Filtraggio dei Picchi (Opzionale)
-
- Abilita un filtro media + k·σ per limitare i bar di flash-crash.
- Moltiplicatore σ configurabile.
🔹 Come Installare e Usare
- Scarica
NNFXATRInfoIndicator_v1.1.algo. - In cTrader → Algo → Indicators, clicca Import Indicator e seleziona il file
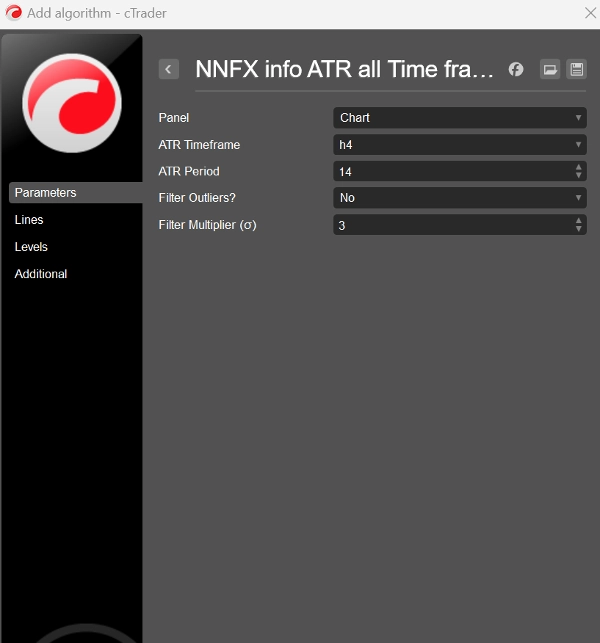
.algo. - Aggiungi al Grafico e apri la scheda Parametri:
-
- Timeframe ATR: es. H4
- Periodo ATR: default 14
- Moltiplicatore TP: 1 – 4.5
- Usare il Filtro Picchi?: Sì/No
- Moltiplicatore Filtro σ: default 3
- Clicca Aggiungi al Grafico. Vedrai il pannello “TP × SL” in alto a sinistra e le etichette ATR degli ultimi 10 bar apparire automaticamente (se i timeframe corrispondono).
🔹 Perché Ti Piacerà
- Zero Calcoli: Niente più conversioni da decimali a pips—tutto è in pips interi.
- Pronto per NNFX: SL e TP dimensionati esattamente secondo le regole ATR del tuo sistema. Devi solo scegliere il timeframe e la direzione di trading che vuoi seguire—poi semplicemente regola il Moltiplicatore TP per adattare il rapporto rischio-rendimento preferito.
- Chiaro e Pulito: Tutte le informazioni sulla volatilità in un’unica sovrapposizione compatta—niente pannelli extra.
- Ultra-Flessibile: Qualsiasi coppia FX, qualsiasi timeframe, completamente personalizzabile.
- potenzia le tue entrate NNFX con stop e target precisi basati su ATR!
Riepilogo
Profilo indicatore
Recensioni dei clienti
5.0
Recensioni: 1
5 | 100 % | |
4 | 0 % | |
3 | 0 % | |
2 | 0 % | |
1 | 0 % |
Recensioni dei clienti
May 3, 2025
the first test should keep DD under 3 percent, and the trade idea gets a pause before execution.
Discussioni
Domande frequenti
ATR
I prodotti disponibili tramite cTrader Store, inclusi bot di trading, indicatori e plugin, sono forniti da sviluppatori terzi e resi disponibili esclusivamente a scopo informativo e di accesso tecnico. cTrader Store non è un broker e non fornisce consulenze in materia di investimento, raccomandazioni individualizzate o garanzie di risultati futuri.


Prezzo
Da 24/04/2025
27.69M
Volume negoziato
629.04K
Profitto in pip