
คำอธิบาย
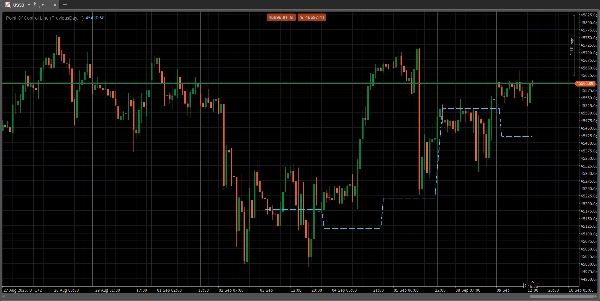
จุดควบคุม (POC) คือระดับราคาบนแผนภูมิโปรไฟล์ปริมาณที่มีปริมาณการซื้อขายมากที่สุดในช่วงเวลาที่กำหนด ระดับนี้ทำหน้าที่เป็นโซนสนับสนุนหรือแนวต้านที่สำคัญเนื่องจากเป็นตัวแทนของราคาที่สถาบันการค้าขนาดใหญ่มีความเคลื่อนไหวมากที่สุดและเป็นที่ที่ราคาตลาดพบความเห็นพ้องต้องกัน นักเทรดใช้ POC เพื่อระบุโซนราคาสำคัญ ประเมินความรู้สึกของตลาด และคาดการณ์การเคลื่อนไหวของราคาและการกลับตัวที่อาจเกิดขึ้น
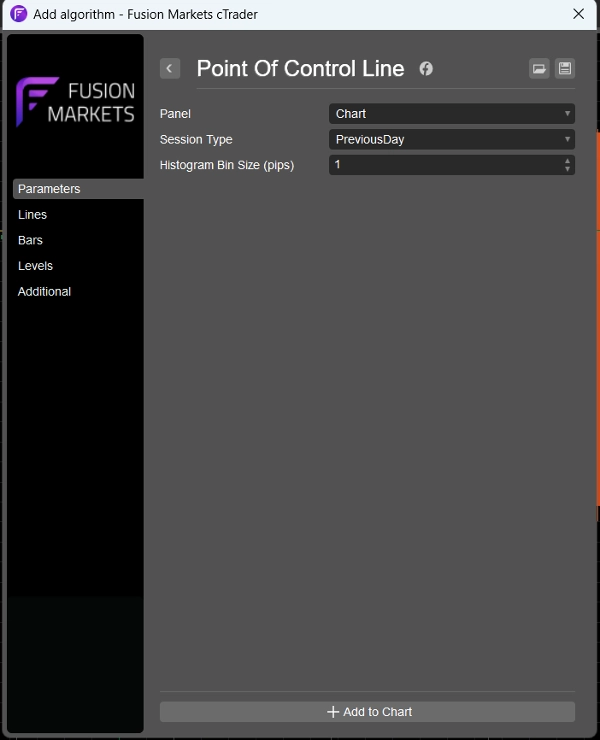
ฉันได้ลบเสียงรบกวนทั้งหมดออกจากตัวบ่งชี้โปรไฟล์ปริมาณทั่วไป เหลือเพียงเส้น POC สำหรับผู้ที่ต้องการเพียงเส้นนี้เท่านั้น ฉันได้เพิ่มพารามิเตอร์เพื่อดูเส้น POC สำหรับโปรไฟล์ปริมาณของวันก่อนหน้า 4 ชั่วโมง หรือ 1 ชั่วโมง จึงเหมาะสำหรับนักเทรดในกรอบเวลาที่แตกต่างกัน
สรุป
โปรไฟล์อินดิเคเตอร์
รีวิวจากลูกค้า
5.0
รีวิว: 2
5 | 100 % | |
4 | 0 % | |
3 | 0 % | |
2 | 0 % | |
1 | 0 % |
รีวิวจากลูกค้า
September 16, 2025
The log becomes easier to read, but impatience can still break the idea.
September 15, 2025
การสนทนา
คำถามที่พบบ่อย
Forex
Indices
ผลิตภัณฑ์ที่มีให้บริการผ่าน cTrader Store รวมถึงบอทการเทรด อินดิเคเตอร์ และปลั๊กอิน มีให้บริการโดยนักพัฒนาบุคคลที่สามและมีไว้เพื่อวัตถุประสงค์ในการเข้าถึงข้อมูลและทางเทคนิคเท่านั้น cTrader Store ไม่ใช่โบรกเกอร์และไม่ได้ให้คำแนะนำการลงทุน คำแนะนำส่วนบุคคล หรือการรับประกันผลการดำเนินงานในอนาคต


!["[Stellar Strategies] MARSI Signal Plotter" โลโก้](https://cdn.ctrader.com/image/webp/7b2b8da6-8f8e-4646-8d4a-4710c516c01e_25567)
ราคา
ตั้งแต่ 21/04/2025