
TwoSMA PRO
Gösterge
Sürüm 1.0, Jan 2026
Windows, Mac
4.5
Değerlendirmeler: 2
Açıklama
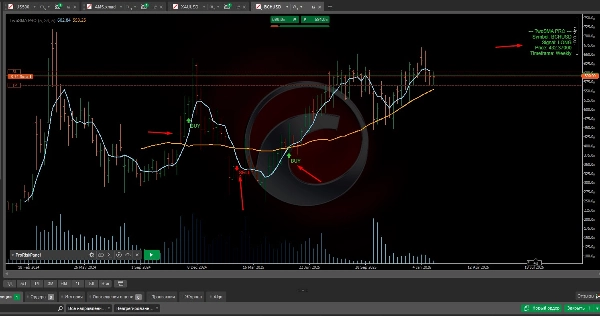
TwoSMA, hızlı ve yavaş SMA kesişimine dayanan bir trend takip göstergesidir. Düz piyasalardan kaçınmak için minimum mesafe ve ATR filtresi kullanır, yükseliş ve düşüş bölgelerini vurgular ve disiplinli ticaret için net ALIŞ ve SATIŞ sinyalleri üretir.
Özet
Gösterge profili
Müşteri değerlendirmeleri
4.5
Değerlendirmeler: 2
5 | 50 % | |
4 | 50 % | |
3 | 0 % | |
2 | 0 % | |
1 | 0 % |
Müşteri değerlendirmeleri
January 16, 2026
January 8, 2026
Is cleaner when the setup has room to breathe. Bad settings can ruin the idea.
Tartışma
SSS
Forex
Crypto
Stocks
ATR
cTrader Store üzerinden erişilebilen işlem botları, göstergeler ve eklentiler gibi ürünler, üçüncü taraf sağlayıcılar tarafından sağlanır ve yalnızca bilgilendirme ve teknik erişim amaçlarıyla sunulur. cTrader Store bir broker değildir ve yatırım tavsiyesi, kişisel öneriler vermez veya gelecekteki performansı garanti etmez.
Bu oluşturanın diğer ürünleri


Fiyat
Başlangıç 11/01/2025
4
Satışlar
443
Ücretsiz yüklemeler