
STC
Gösterge
278 i̇ndirmeler
Sürüm 1.0, Jan 2025
Windows, Mac
5.0
Değerlendirmeler: 2
Açıklama
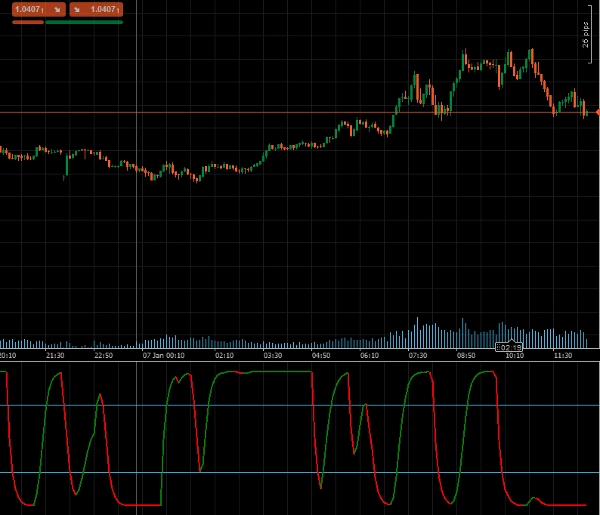
Schaff Trend Cycle (STC) , ünlü teknik analist Doug Schaff tarafından geliştirilen, piyasa trendlerini ve dönüşlerini olağanüstü hız ve hassasiyetle tanımlamak için tasarlanmış gelişmiş bir ticaret göstergesidir. Trend ve döngü bileşenlerini birleştirme yenilikçi fikrine dayanan STC, MACD veya Stokastik Osilatör gibi gecikmeli göstergelerin sınırlamalarını aşmak için üssel hareketli ortalamalar (EMA'lar) ve stokastik hesaplamalar kullanır. Bu benzersiz yaklaşım, daha erken ve daha güvenilir ticaret sinyalleri sağlayarak trend tespiti ve piyasa analizinde önemli bir avantaj sunar.
Temel Özellikler:
- Erken Trend Tespiti: Trendleri daha hızlı yakalamak için üssel hareketli ortalamalar (EMA'lar) ile stokastik hesaplamaları birleştirir.
- Özelleştirilebilir Ayarlar: Ticaret stratejinize uyacak şekilde uzunluk, hızlı MA, yavaş MA, MA tipi ve yumuşatma faktörünü ayarlayın.
- Görsel Uyarılar: Dinamik renk değişiklikleri, boğa veya ayı trendlerini göstererek piyasa koşullarını kolayca yorumlamanızı sağlar.
- Aşırı Alım/Aşırı Satım Seviyeleri Desteği: Yerleşik seviyeler (25 ve 75), potansiyel piyasa dönüş noktalarını tanımlamaya yardımcı olur.
Parametreler
- Uzunluk: Trend hesaplaması için dönem sayısını tanımlar.
- Hızlı MA Uzunluğu: Hızlı hareketli ortalamanın uzunluğunu belirler.
- Yavaş MA Uzunluğu: Yavaş hareketli ortalamanın uzunluğunu belirtir.
- MA Tipi: Hareketli ortalama tipinin seçilmesine izin verir (örneğin, EMA, SMA).
- Yumuşatma Faktörü: Daha rafine trend sinyalleri için yumuşatma faktörünü ayarlar.
Çıktılar
- STC: Trend yönü ve gücünü temsil eden birincil Schaff Trend Cycle değerini, otomatik ticaret sistemlerinde programatik kullanım için çıktı verir.
- STCBull: Boğa trend koşullarını vurgular.
- STCBear: Ayı trend koşullarını vurgular.
Özet
Gösterge profili
Müşteri değerlendirmeleri
5.0
Değerlendirmeler: 2
5 | 100 % | |
4 | 0 % | |
3 | 0 % | |
2 | 0 % | |
1 | 0 % |
Müşteri değerlendirmeleri
August 12, 2025
Pros: Fast and accurate trend detection, earlier signals than MACD, customizable levels. Cons: No alerts, no MTF mode, no trade statistics.
Tartışma
SSS
MACD
cTrader Store üzerinden erişilebilen işlem botları, göstergeler ve eklentiler gibi ürünler, üçüncü taraf sağlayıcılar tarafından sağlanır ve yalnızca bilgilendirme ve teknik erişim amaçlarıyla sunulur. cTrader Store bir broker değildir ve yatırım tavsiyesi, kişisel öneriler vermez veya gelecekteki performansı garanti etmez.
Bu oluşturanın diğer ürünleri


Fiyat
Başlangıç 24/09/2024
4.46K
Ücretsiz yüklemeler