
PDHL
Chỉ báo
1.84K lượt tải
Phiên bản 1.0, Sep 2024
Windows, Mac
2.5
Đánh giá: 2
Mô tả
Giới thiệu Chỉ báo Giao dịch Cao-Thấp
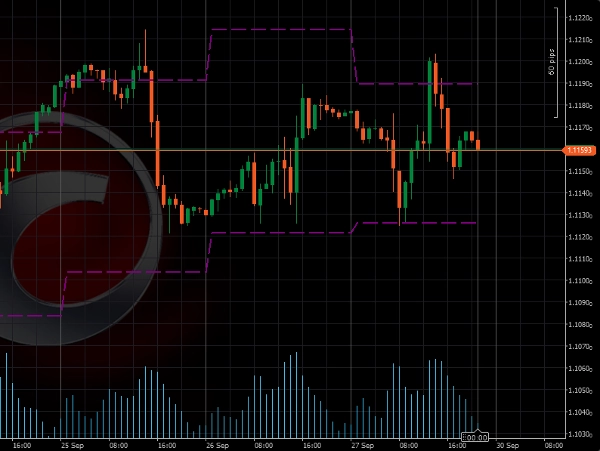
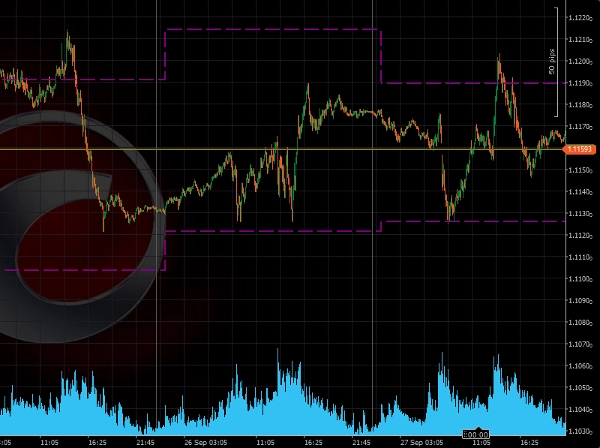
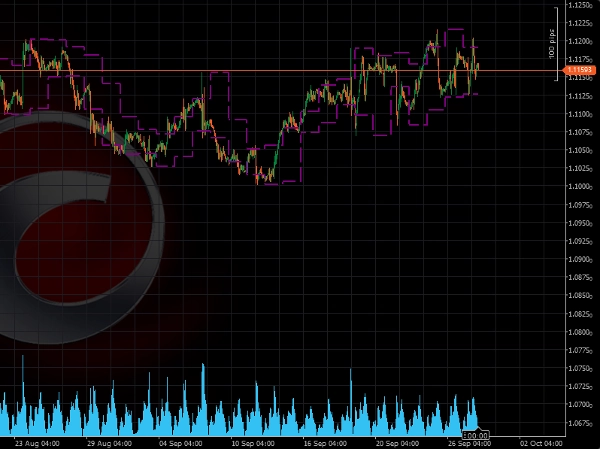
Chỉ báo này được thiết kế để tự động vẽ các mức giá cao nhất và thấp nhất của ngày trước đó trên biểu đồ của bạn. Công cụ này giúp bạn nhanh chóng xác định các mức quan trọng cho các đột phá và đảo chiều tiềm năng.
Lợi ích chính:
- Lý tưởng cho Giao dịch Đột phá: Chỉ báo này làm nổi bật các mức giá quan trọng từ ngày trước, thường được sử dụng làm điểm tham chiếu cho các chiến lược đột phá. Giao dịch đột phá trên hoặc dưới các mức này có thể mang lại các thiết lập tiềm năng cao.
- Đơn giản nhưng Hiệu quả: Chỉ báo Giao dịch Cao-Thấp tập trung vào một trong những khía cạnh quan trọng nhất của hành động giá – mức cao và thấp của ngày trước đó. Bằng cách kết hợp các mức này vào chiến lược của bạn, bạn sẽ có cái nhìn rõ ràng hơn về cấu trúc thị trường và các điểm đảo chiều tiềm năng.
Lưu ý:
- Tốt nhất nên sử dụng trên các khung thời gian dưới 1 Ngày
Cài đặt:
- Bao gồm Chủ nhật: mặc định = không
Tóm tắt
Tóm tắt AI
The PDHL (Previous Day High & Low) indicator automatically plots the prior day's highest and lowest price levels on trading charts. It is designed to assist traders in identifying key price levels that may signal potential breakouts or reversals. By highlighting these critical levels, the indicator supports breakout trading strategies, providing reference points for entering trades when price moves above or below the previous day's range. The tool emphasizes simplicity and effectiveness by focusing on essential price action elements, helping traders better understand market structure and potential turning points. It is best used on intraday timeframes shorter than one day. A configurable setting allows users to include or exclude Sunday in the calculation, with the default setting excluding it.
Hồ sơ chỉ báo
Đánh giá của khách hàng
2.5
Đánh giá: 2
5 | 0 % | |
4 | 0 % | |
3 | 50 % | |
2 | 50 % | |
1 | 0 % |
Đánh giá của khách hàng
October 9, 2025
What Timezone is it in at default? It seems to fail to get the accurate Highs and lOws for different istruments. You could add that as a customisable input. Please add closing price too
July 9, 2025
Pros: Simple and clear display of previous day's high/low levels. Stable performance. Easy to use and customize. Cons: No breakout alerts. No visual zone fill option. Lacks additional filters or Fibo levels.
Thảo luận
Câu hỏi thường gặp
Breakout
Các sản phẩm có sẵn trên cTrader Store, bao gồm bot giao dịch, chỉ báo và plugin, được cung cấp bởi các nhà phát triển bên thứ ba và chỉ nhằm mục đích cung cấp thông tin và tiếp cận kỹ thuật. cTrader Store không phải là nhà môi giới và không cung cấp lời khuyên đầu tư, khuyến nghị cá nhân hay bất kỳ đảm bảo nào về hiệu suất trong tương lai.
Sản phẩm khác của tác giả này


![Logo "[Hamster-Coder] Pivot Points (Demo)"](https://cdn.ctrader.com/image/webp/87b54299-8c73-4942-9207-4bc6db824811_31153)


Giá
Kể từ 24/09/2024
4.46K
Cài đặt miễn phí