Precision FVG Analizi - Profesyonel Adil Değer Boşluğu Göstergesi
Genel Bakış
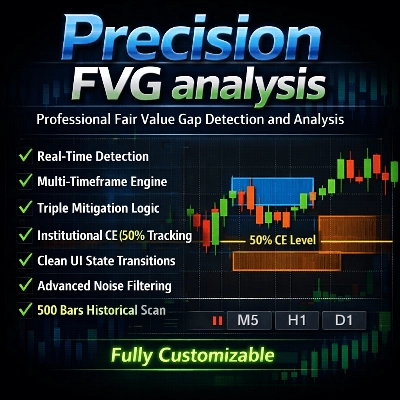
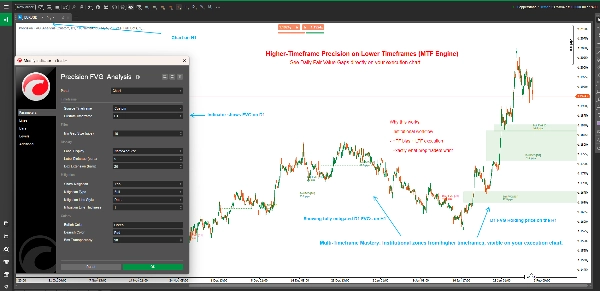
Precision FVG Analizi, Akıllı Para Kavramları (SMC) ve ICT metodolojilerini kullanan ciddi yatırımcılar için tasarlanmış güçlü ve esnek bir Adil Değer Boşluğu (FVG) tespit göstergesidir. Bu gelişmiş gösterge, birden çok zaman diliminde Adil Değer Boşluklarını otomatik olarak tanımlar, takip eder ve gelişmiş azaltma takip yetenekleriyle görselleştirir.
Adil Değer Boşlukları, fiyatın çok hızlı hareket ettiği ve genellikle tekrar ziyaret edilen verimsizlikler bıraktığı piyasa dengesizliklerini temsil eder. Bu boşlukları anlamak ve işlem yapmak, modern fiyat hareketi yatırımcıları için çok önemlidir.
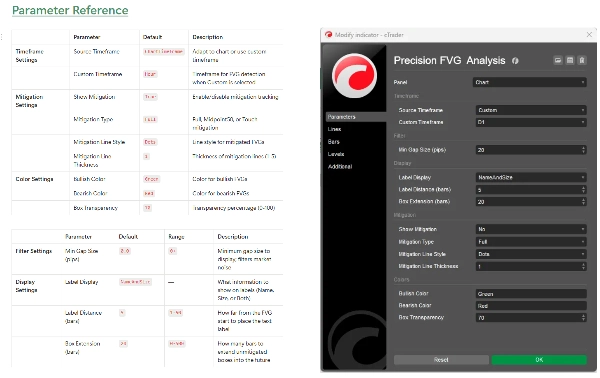
Ana Özellikler
🎯 Çoklu Zaman Dilimi Analizi
- Uyarlanabilir Zaman Dilimi Tespiti: FVG'leri mevcut grafik zaman diliminden veya herhangi bir özel zaman diliminden görüntülemeyi seçin
- Zaman Dilimleri Arası İşlem: Daha iyi işlem bağlamı için alt zaman dilimi grafiklerinde üst zaman dilimi FVG'lerini görüntüleyin
- Akıllı Zaman Dilimi Etiketleri: Özel zaman dilimleri kullanıldığında etiketlerde otomatik zaman dilimi tanımlaması
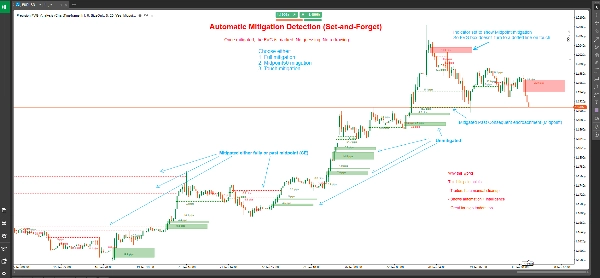
📊 Gelişmiş Azaltma Takibi
- Üç Azaltma Türü:
-
- Tam Azaltma: Fiyat boşluğu tamamen doldurur (en muhafazakar)
- %50 Orta Nokta (CE): Fiyat Sonraki İhlal seviyesine ulaşır (denge yaklaşımı)
- Dokunma Azaltması: Fiyat boşluk sınırına dokunur (en hassas)
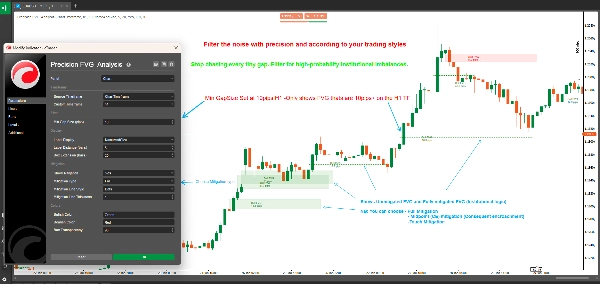
- Görsel Durum Değişiklikleri: Azaltılmamış FVG'ler dolu kutular olarak gösterilir; azaltılmış FVG'ler noktalı çizgilere dönüşür
- Kesin Azaltma İşaretleme: Azaltmanın gerçekleştiği tam mumu gösterir
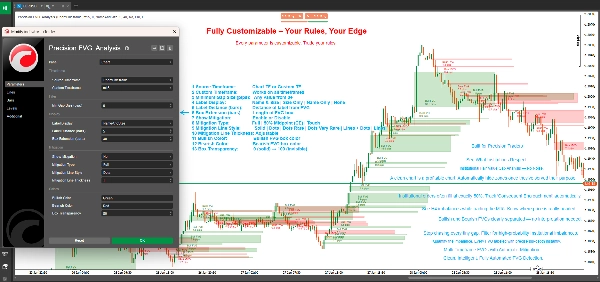
🎨 Tamamen Özelleştirilebilir Görünüm
- Esnek Kutu Uzatma: FVG kutularının geleceğe ne kadar uzatılacağını kontrol edin (0-500 bar)
- Akıllı Etiketleme Sistemi: Dört etiket modundan seçim yapın:
-
- İsim ve Boyut: FVG türü ve pip boyutu ile tam detaylar
- Sadece Boyut: Sadece boşluk boyutu pip cinsinden
- Sadece İsim: FVG türü tanımlaması
- Hiçbiri: Etiketsiz temiz grafik
- Özel Renkler: Boğa ve ayı renk şemalarını ayrı ayrı ayarlayın
- Ayarlanabilir Şeffaflık: Kutu şeffaflığı %0-100 arasında
- Azaltma Çizgisi Özelleştirmesi: Azaltılmış FVG'ler için çizgi stili ve kalınlığı seçin
⚙️ Profesyonel Filtreleme
- Minimum Boşluk Boyutu Filtresi: Önemsiz boşlukları filtrelemek için minimum pip gereksinimini ayarlayın
- Otomatik Tespit: Her yeni mum kapanışında gerçek zamanlı FVG tanımlaması
- Tarihsel Tarama: Başlangıçta otomatik olarak 500 tarihsel bar tarar
Adil Değer Boşlukları Nedir?
Adil Değer Boşlukları (FVG'ler), üç ardışık mum arasında fiyat verimsizliği olduğunda oluşur:
Boğa FVG: Mevcut mumun düşük seviyesi, iki bar önceki mumun yüksek seviyesinden daha yüksektir ve ortadaki mum bu yüksek seviyenin üzerinde kapanır. Bu, genellikle destek görevi gören yukarı yönlü bir boşluk oluşturur.
Ayı FVG: Mevcut mumun yüksek seviyesi, iki bar önceki mumun düşük seviyesinden daha düşüktür ve ortadaki mum bu düşük seviyenin altında kapanır. Bu, genellikle direnç görevi gören aşağı yönlü bir boşluk oluşturur.
Bu boşluklar, agresif alım veya satımın gerçekleştiği, piyasanın orijinal yönüne devam etmeden önce "adil değer" için sık sık tekrar ziyaret ettiği fiyat dengesizliklerini temsil eder.
Azaltma Türlerini Anlamak
Tam Azaltma (Muhafazakar)
- Boğa FVG: Fiyat boşluğun altının altına düştüğünde azaltılmış sayılır
- Ayı FVG: Fiyat boşluğun üstünün üzerine çıktığında azaltılmış sayılır
- Kullanım Durumu: Boşluğun tamamen doldurulduğunun teyidi, swing traderlar ve onay arayan stratejiler için uygundur
%50 Orta Nokta / CE (Dengeli)
- Boğa FVG: Fiyat orta noktaya ulaştığında veya altına geçtiğinde azaltılmış sayılır
- Ayı FVG: Fiyat orta noktaya ulaştığında veya üzerine çıktığında azaltılmış sayılır
- Kullanım Durumu: Sonraki İhlal (CE) seviyesi genellikle kurumların emir verdiği yerdir, bu da iyi risk-ödül ile girişler için idealdir
Dokunma Azaltması (Agresif)
- Boğa FVG: Fiyat üst sınırına dokunduğunda veya geçtiğinde azaltılmış sayılır
- Ayı FVG: Fiyat alt sınırına dokunduğunda veya geçtiğinde azaltılmış sayılır
- Kullanım Durumu: FVG sınırlarındaki reaksiyonları yakalamak isteyen traderlar için erken uyarı sistemi, scalping ve hızlı girişler için idealdir
Nasıl Kullanılır
Temel Kurulum
- Grafiğinize Precision FVG Analizi ekleyin
- Tercih ettiğiniz Kaynak Zaman Dilimini ayarlayın:
-
- Mevcut grafikte FVG'leri tespit etmek için "ChartTimeframe" seçin
- Daha yüksek zaman dilimi FVG'lerini görmek için "Custom" seçin ve belirli bir zaman dilimi seçin (ör. H4, D1)
- Küçük, önemsiz boşlukları filtrelemek için Min Gap Size ayarını yapılandırın (önerilen: forex için 2-5 pip)
Azaltma Yapılandırması
- Azaltma takibini etkinleştirmek için Show Mitigation seçeneğini açın
- İşlem tarzınıza göre Mitigation Type seçin:
-
- Günlük traderlar ve scalperlar: "Touch" veya "Midpoint50" seçeneklerini düşünün
- Swing traderlar: Onay için "Full" kullanın
- Azaltma çizgisi görünümünü Line Style ve Thickness ile özelleştirin
Görsel Özelleştirme
- Kutu projeksiyonunu kontrol etmek için Box Extension ayarlayın (varsayılan 20 bar)
- Tercih ettiğiniz Label Display seçeneğini belirleyin
- Grafik temanızla uyumlu olması için Bullish Color ve Bearish Color ayarlarını yapın
- Optimum görünürlük için Box Transparency ayarını ince ayar yapın
İşlem Stratejileri
Strateji 1: Daha Yüksek Zaman Dilimi FVG ile Daha Düşük Zaman Dilimi Girişi
- M15 veya M5 grafikte göstergenizi H4 veya D1 zaman dilimine ayarlayın
- Azaltılmamış daha yüksek zaman dilimi FVG'lerini tespit edin
- Fiyatın alt zaman diliminde FVG'ye yaklaşmasını bekleyin
- Alt zaman dilimi onaylarını arayın (mum formasyonları, emir blokları vb.)
- Fiyat seçtiğiniz azaltma seviyesine ulaştığında giriş yapın
Strateji 2: FVG Kesişim Bölgeleri
- Farklı zaman dilimleriyle göstergenin birden fazla örneğini kullanın
- Birden fazla zaman dilimi FVG'sinin üst üste geldiği alanları tespit edin
- Bu kesişim bölgeleri yüksek olasılıklı işlem noktaları sunar
- Girişlerinizi tam zamanında yapmak için azaltma takibini kullanın
Strateji 3: Kırılma Onayı
- Ana destek/direnç seviyelerini belirleyin
- Kırılmalar sırasında FVG oluşumlarını izleyin
- Kırılma yönündeki azaltılmamış FVG'ler devam sinyali verir
- Azaltılmış FVG'ler potansiyel başarısız kırılma veya dönüş sinyali verir
Strateji 4: Azaltma Tabanlı Scalping
- Alt zaman dilimlerinde (M1, M5) Dokunma Azaltmasını kullanın
- FVG'ye dokunulduğunda hemen giriş yapın
- Önceki swing yüksek/düşük seviyesini hedefleyin
- FVG'nin altına/üstüne sıkı stoplar koyun
Teknik Özellikler
- Platform: cTrader
- Tür: Üst Grafik Göstergesi
- Hesaplama: Bar kapanışında gerçek zamanlı
- Tarihsel Barlar: Başlangıçta 500 bara kadar tarama yapar
- Maksimum Aktif FVG: Aynı anda 500 boşluk
- Kaynak Kullanımı: Hafif ve performans için optimize edilmiş
En İyi Uygulamalar
Genel İşlem Rehberleri
- Diğer Kavramlarla Birleştirin: FVG'ler, emir blokları, likidite havuzları ve piyasa yapısı ile birleştiğinde en iyi sonucu verir
- Piyasa Bağlamına Saygı Gösterin: Daha yüksek zaman dilimi FVG'leri, daha düşük zaman dilimlerinden daha fazla ağırlığa sahiptir
- Birden Fazla Zaman Dilimi Kullanın: Kesişim için farklı zaman dilimi FVG'lerini katmanlayın
- Risk Yönetimi: Her zaman uygun stop loss kullanın; tüm FVG'ler tutmayabilir
Optimizasyon İpuçları
- Min Gap Size Ayarı: Enstrümanınızın ortalama volatilitesine göre ayarlayın
- Kutu Uzatma: Swing trading için daha uzun (50-100 bar), günlük işlem için daha kısa (10-20 bar)
- Azaltma Türü: İşlem zaman diliminiz ve tarzınıza uygun seçin
- Etiket Mesafesi: Grafik karmaşası ve zoom seviyesine göre ayarlayın
Kaçınılması Gereken Yaygın Hatalar
- Aşırı İşlem: Her FVG bir işlem fırsatı değildir
- Bağlamı Görmezden Gelmek: Güçlü trendlerin tersindeki FVG'ler daha az güvenilirdir
- Yanlış Azaltma Türü: Tam azaltma kullanan scalperlar girişleri kaçırır; dokunma kullanan swing traderlar stoplara takılır
- Onay Eksikliği: Her zaman FVG seviyelerinde fiyat hareketi onayı bekleyin
Sıkça Sorulan Sorular
S: Neden bazı FVG'ler hemen kayboluyor? C: "Show Mitigation" "Touch" azaltması ile etkinleştirildiğinde, hemen geri çekilen FVG'ler hızla noktalı çizgilere dönüşür. Bu normal bir davranıştır.
S: Birden fazla zaman dilimi FVG'sini aynı anda görebilir miyim? Evet! Çoklu zaman dilimi analizi için göstergenin farklı özel zaman dilimleriyle birden fazla örneğini grafiğinize ekleyin.
S: Bu gösterge diğer FVG göstergelerinden farkı nedir? Precision FVG Analizi, çoklu zaman dilimi yeteneği, üç azaltma türü ve durum tabanlı render ile üstün görsel netlik (kutular vs çizgiler) sunar.
S: Hangi azaltma türünü kullanmalıyım? Midpoint50 (CE) ile başlayın çünkü erken sinyaller ile güvenilirliği dengeler. Sonuçlarınıza ve işlem tarzınıza göre ayarlayın.
S: Bu tüm enstrümanlarda çalışır mı? Evet, gösterge Forex, Endeksler, Emtialar ve Kripto Paralar üzerinde çalışır. Enstrüman volatilitesine göre "Min Gap Size" parametresini ayarlayın.
S: Tarihsel tarama ne kadar geriye gider? Gösterge başlangıçta 500 bara kadar tarama yapar, kapsamlı tarihsel bağlam sağlar.
Destek ve Güncellemeler
Bu gösterge aktif olarak bakım ve güncelleme almaktadır. Kullanıcılar şunları alır:
- Yeni özelliklerle düzenli güncellemeler
- Performans optimizasyonları
- Hata düzeltmeleri ve iyileştirmeler
- Dokümantasyon güncellemeleri
Sorular, öneriler veya destek için lütfen cTrader mağaza mesajlaşma sistemi üzerinden iletişime geçin.
Feragatname
İşlem yapmak önemli kayıp riski taşır ve tüm yatırımcılar için uygun değildir. Geçmiş performans gelecekteki sonuçların göstergesi değildir. Bu gösterge analiz için bir araçtır ve finansal tavsiye teşkil etmez. Her zaman uygun risk yönetimi uygulayın ve kaybetmeyi göze alabileceğinizden fazlasını riske atmayın.
Sürüm Geçmişi
Sürüm 1.0 (Mevcut)
- Çoklu zaman dilimi FVG tespiti
- Üç azaltma türü (Tam, Midpoint50, Dokunma)
- Görsel durum değişiklikleri (kutulardan noktalı çizgilere)
- Özelleştirilebilir renkler ve şeffaflık
- Esnek etiketleme sistemi
- Tarihsel tarama (500 bar)
- Gerçek zamanlı tespit ve takip
Precision FVG Analizi - Adil Değer Boşluğu işlemlerinizi profesyonel seviyeye taşıyın.
5 | 100 % | |
4 | 0 % | |
3 | 0 % | |
2 | 0 % | |
1 | 0 % |


