
NÓ LÀM GÌ
Đường trung bình động có thể kéo được cố định một đường trung bình động vào bất kỳ điểm nào trong lịch sử giá — không phải từ thanh số không, không phải từ khoảng thời gian cố định, mà chính xác từ nơi bạn đặt nó.
Các đường trung bình động tiêu chuẩn bắt đầu từ đầu dữ liệu biểu đồ và hội tụ theo thời gian. Chu kỳ của chúng là cố định. Điểm tham chiếu bắt đầu của chúng là tùy ý. Khi bạn muốn đo lường cách giá đã phát triển kể từ một sự kiện cấu trúc cụ thể — một khởi đầu điều chỉnh, một khởi đầu xung lực, một điểm xoay quan trọng — không có cách nào để cố định MA vào khoảnh khắc đó.
Chỉ báo này giải quyết vấn đề đó.
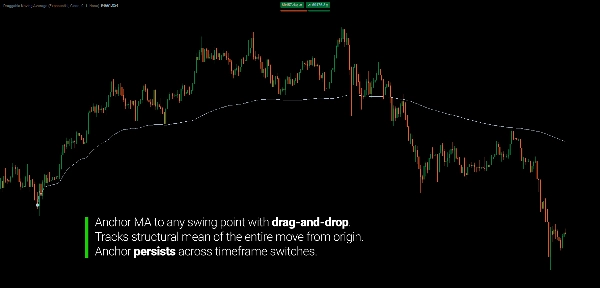
Đặt biểu tượng neo trên bất kỳ thanh nào. MA bắt đầu từ thanh đó và kéo dài về phía trước. Kéo biểu tượng đến một thanh khác — MA sẽ tính toán lại ngay lập tức từ vị trí mới. Chuyển đổi khung thời gian — neo giữ nguyên, MA tự động tính toán lại trên biểu đồ mới.
Kết quả là một đường trung bình động luôn phản ánh cách giá đã phát triển từ một điểm cấu trúc cụ thể mà bạn xác định.
LỢI ÍCH CỐT LÕI
Cách tiếp cận tiêu chuẩn:
- Xác định điểm bắt đầu của một chuyển động điều chỉnh hoặc xung lực
- Áp dụng MA với chu kỳ cố định — nó bắt đầu từ đầu biểu đồ, không phải cấu trúc của bạn
- Điều chỉnh chu kỳ thủ công để gần đúng độ dài của cấu trúc
- Chuyển đổi khung thời gian — chu kỳ trở nên vô nghĩa với số lượng thanh khác nhau
- Lặp lại mỗi khi cấu trúc thay đổi
Cách tiếp cận có thể kéo được:
- Đặt neo tại điểm bắt đầu của cấu trúc
- MA tính toán tiến về phía trước từ chính xác thanh đó
- Chuyển đổi khung thời gian — neo giữ nguyên, MA tự động tính toán lại
- Kéo để điều chỉnh — mọi thứ cập nhật ngay lập tức
Sự khác biệt là về cấu trúc. Thay vì gần đúng một điểm tham chiếu thông qua điều chỉnh chu kỳ, bạn xác định nó trực tiếp. Điểm cấu trúc là đầu vào — không phải chu kỳ.
CỐ ĐỊNH VÀO CẤU TRÚC: PHÁT HIỆN SỰ QUAY VỀ TRUNG BÌNH VÀ ĐẢO CHIỀU
Khi một đường trung bình động bắt đầu từ một điểm xoay cấu trúc — nguồn gốc của một xu hướng, khởi đầu của một xung lực, hoặc bắt đầu của một đợt điều chỉnh — nó không còn là một đường làm mượt tùy ý mà bắt đầu hành xử như một trung bình cấu trúc.
Giá tổ chức quanh trung bình đó theo những cách có thể dự đoán:
- Trong quá trình di chuyển, giá dao động quanh MA neo — tách ra trong các đợt bùng nổ động lượng, trở lại MA trong giai đoạn tích lũy. MA phản ánh giá trung bình của toàn bộ cấu trúc từ nguồn gốc của nó, không chỉ các thanh gần đây.
- Khi kiệt sức, giá bắt đầu cắt qua MA neo thay vì bật lên từ nó. Đóng cửa dưới MA neo dốc lên — một MA đã theo dõi một xung lực từ nguồn gốc của nó — mang ý nghĩa cấu trúc. Trung bình của toàn bộ chuyển động đang bị vi phạm.
- Sau khi đảo chiều, MA neo trở thành kháng cự. Việc kiểm tra lại MA từ phía dưới đánh dấu các khu vực hợp lý nơi trung bình cấu trúc trước đó đóng vai trò như nguồn cung.
Hành vi này nhất quán vì MA đang đo đúng thứ: giá trung bình của một chuyển động cấu trúc cụ thể từ điểm bắt đầu thực tế của nó, không phải từ một chu kỳ tùy ý trước đó.
CÁC LOẠI MA HỖ TRỢ
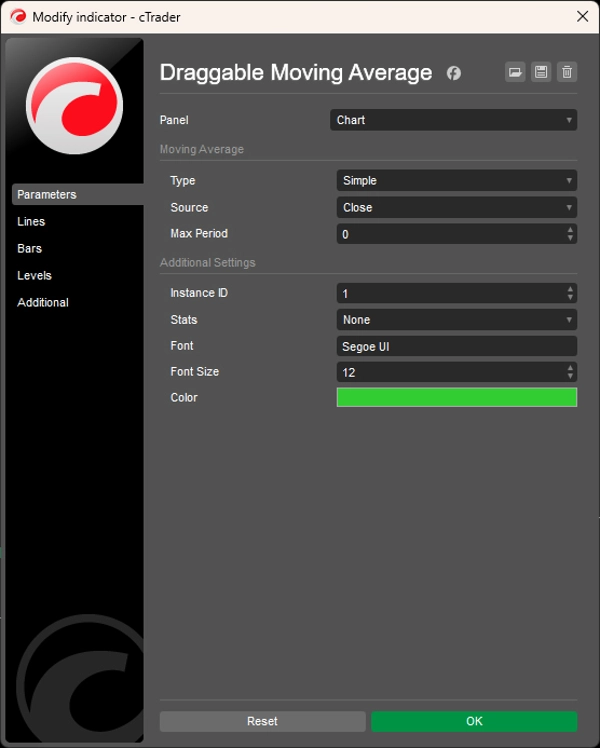
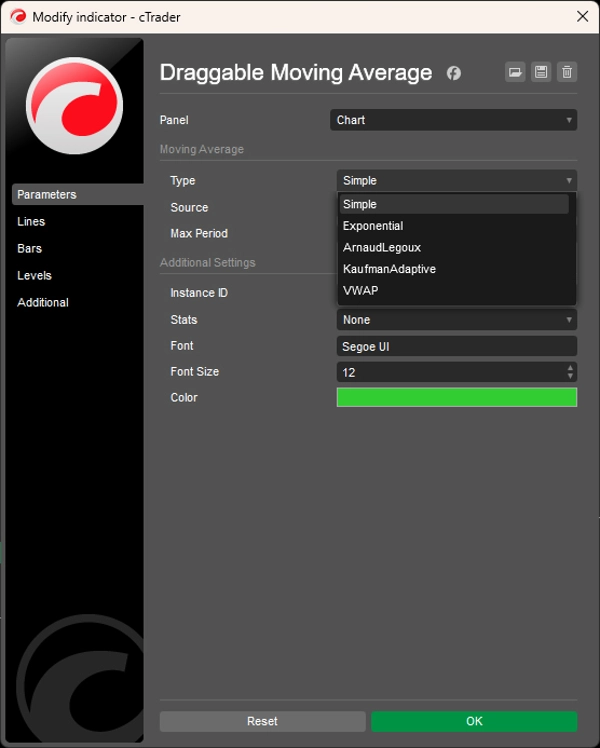
Năm phương pháp tính toán, có thể chọn cho từng trường hợp:
- Đơn giản (SMA) — trung bình số học từ neo tiến về phía trước; tăng dần với mỗi thanh cho đến khi đạt Chu kỳ Tối đa
- Hàm mũ (EMA) — trọng số hàm mũ; phản ứng nhanh hơn với hành động giá gần đây
- Arnaud Legoux (ALMA) — trọng số Gaussian; giảm độ trễ mà không làm tăng nhiễu
- Kaufman Adaptive (KAMA) — điều chỉnh làm mượt động dựa trên tỷ lệ hiệu quả thị trường; thu hẹp trong điều kiện xu hướng, mở rộng trong giai đoạn tích lũy
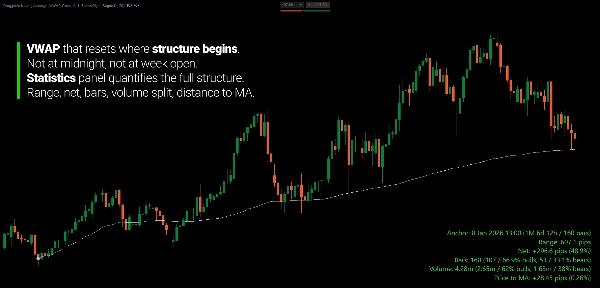
- VWAP — trung bình trọng số theo khối lượng từ neo; phản ánh nơi phần lớn khối lượng đã giao dịch kể từ điểm cấu trúc
Tất cả các loại đều tuân thủ tham số Chu kỳ Tối đa — giới hạn cửa sổ nhìn lại trong khi giữ neo làm điểm tham chiếu gốc.
BẢNG THỐNG KÊ
Bảng phủ tùy chọn, có thể chọn ở bốn vị trí góc, hiển thị các chỉ số thời gian thực từ neo đến thanh hiện tại:
- Phạm vi tính bằng pip (cao nhất đến thấp nhất)
- Thay đổi ròng tính bằng pip và phần trăm
- Tổng số thanh với số lượng tăng/giảm và tỷ lệ phần trăm
- Tổng khối lượng với phân chia tăng/giảm và tỷ lệ phần trăm
- Khoảng cách giá hiện tại so với MA tính bằng pip và phần trăm
- Thời gian và bộ đếm thanh từ thanh neo đến thanh hiện tại
Hữu ích để định lượng chính xác cấu trúc bạn đã neo — không chỉ đường MA, mà còn toàn bộ hồ sơ thống kê của chuyển động giá từ gốc đến hiện tại.
HỖ TRỢ NHIỀU TRƯỜNG HỢP
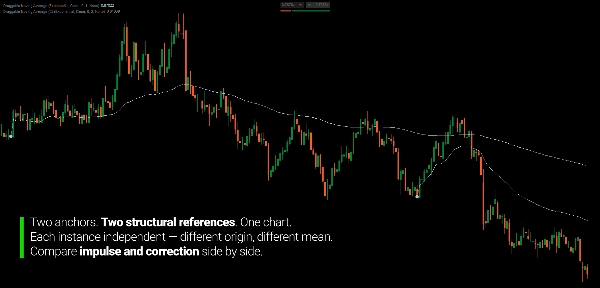
Mỗi trường hợp mang một ID Trường hợp duy nhất. Nhiều trường hợp có thể chạy đồng thời — một neo vào đầu một đợt điều chỉnh, một neo khác vào xung lực trước đó — mà không gây xung đột biểu tượng hoặc nhãn.
TÍNH NĂNG CHÍNH
- Biểu tượng neo có thể kéo được — đặt trên bất kỳ thanh nào, kéo để điều chỉnh, MA cập nhật ngay lập tức
- Năm loại MA (SMA, EMA, ALMA, KAMA, VWAP)
- Tám nguồn giá (Mở, Cao, Thấp, Đóng, Trung bình, Trung vị, Điển hình, Trọng số)
- Giới hạn Chu kỳ Tối đa với cửa sổ lăn từ nguồn neo
- Bảng thống kê tùy chọn với bốn vị trí góc
- Hỗ trợ nhiều trường hợp với ID Trường hợp duy nhất
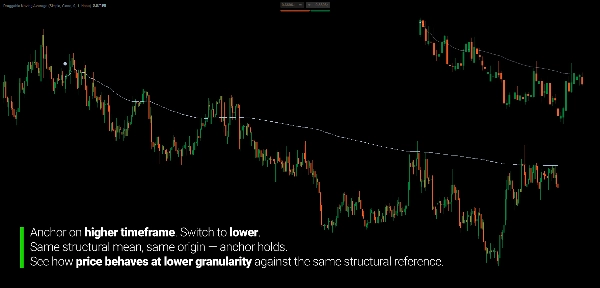
- Neo bền vững qua các lần chuyển đổi khung thời gian
DÀNH CHO AI
Chỉ báo này dành cho các nhà giao dịch phân tích cấu trúc thị trường qua các khung thời gian — đặc biệt là những người muốn đo hành vi giá từ một điểm tham chiếu cấu trúc xác định thay vì một khoảng thời gian nhìn lại tùy ý.
Nếu bạn phân tích các chân điều chỉnh và xung lực trên các khung thời gian cao hơn và cần đánh giá cùng cấu trúc đó ở độ chi tiết khung thời gian thấp hơn, neo có thể kéo cho phép bạn đánh dấu điểm bắt đầu cấu trúc một lần và mang nó qua các khung thời gian khác nhau. Neo trên biểu đồ hàng ngày, chuyển sang M15 — điểm tham chiếu vẫn giữ nguyên.
Nó phù hợp với nhà giao dịch swing và vị thế nghĩ theo các chuyển động cấu trúc thay vì chu kỳ cố định, nhà phân tích đa khung thời gian cần điểm tham chiếu nhất quán trên các biểu đồ, và nhà giao dịch tùy ý muốn neo MA chính xác do người dùng định nghĩa mà không phải đoán chu kỳ.
Đây không phải là hệ thống tín hiệu. Nó là công cụ đo lường cấu trúc dành cho những nhà giao dịch đã nghĩ theo chuyển động giá và muốn đường trung bình động phản ánh chính xác những chuyển động đó.
ĐIỀU GÌ LÀM NÓ KHÁC BIỆT
Các đường trung bình động tiêu chuẩn dựa trên chu kỳ. Điểm tham chiếu của chúng là ngầm định — n thanh trước thanh hiện tại. Khi một chuyển động cấu trúc kết thúc và một chuyển động mới bắt đầu, chu kỳ trở nên không liên quan. Bạn không thể chỉ định một MA tiêu chuẩn vào một sự kiện cụ thể.
Chỉ báo này làm cho điểm tham chiếu trở nên rõ ràng. Bạn neo vào một sự kiện cấu trúc. MA đo từ đó. Chu kỳ không phải là đầu vào — điểm cấu trúc mới là đầu vào.
Kết quả: một đường trung bình động phản ánh phân tích cấu trúc thực tế của bạn thay vì một sự gần đúng.
---
HIỂU ĐƯỜNG TRUNG BÌNH ĐỘNG NHƯ MỘT TRUNG BÌNH CẤU TRÚC
Đường trung bình động thường bị hiểu nhầm là các mức hỗ trợ và kháng cự. Các nhà giao dịch chờ giá "tôn trọng" MA 50 hoặc bật lên từ MA 200 như thể những con số đó mang ý nghĩa thị trường vốn có. Thực tế không phải vậy.
Đường trung bình động là mô tả số học của một phân phối — giá trung bình trong một cửa sổ xác định. Điều quyết định liệu đường đó có ý nghĩa hay không không phải là công thức. Mà là liệu cửa sổ được đo có liên quan cấu trúc hay không.
Đây là lý do tại sao các MA dựa trên chu kỳ bị giới hạn về cơ bản. MA 50 chu kỳ đo 50 thanh cuối — một cửa sổ không liên quan đến bất kỳ sự kiện cấu trúc nào. Nó không tương ứng với nơi một xu hướng bắt đầu hoặc nơi một đợt điều chỉnh khởi đầu. Nó là một cửa sổ lăn với độ dài tùy ý mà vị trí được xác định chỉ bởi tính mới nhất.
Khi bạn neo vào một điểm xoay cấu trúc, MA trở thành trung bình của một phân phối giá cụ thể, mạch lạc từ nguồn gốc đó trở về phía trước. Khi giá lệch xa lên trên nó, những người tham gia vào tại nguồn gốc bị kéo dài. Khi giá trở lại nó, điều đó phản ánh sự cân bằng lại phân phối. Khi giá phá vỡ nó một cách rõ ràng, người tham gia trung bình từ nguồn gốc cấu trúc đang hòa vốn hoặc thua lỗ — một sự thay đổi chế độ thống kê, không phải một đường bị phá vỡ.
Hình học không phải là nguyên nhân. Nó là mô tả thống kê của một phân phối cấu trúc mà bạn đã xác định ranh giới.
---
Giao dịch có rủi ro. Chỉ báo này là công cụ phân tích kỹ thuật — luôn áp dụng quản lý rủi ro phù hợp.


