
Mô tả
NÓ LÀM GÌ
Structural Supertrend giải quyết một hạn chế cơ bản của Supertrend cổ điển: nó đổi hướng ngay khi giá đóng cửa vượt ra ngoài dải của nó.
Trong các xu hướng rõ ràng, điều đó hoạt động tốt. Trong điều kiện biến động hoặc dao động, một cây nến mạnh có thể kích hoạt sự đảo chiều — ngay cả khi xu hướng rộng hơn vẫn còn nguyên vẹn về mặt cấu trúc. Kết quả là các tín hiệu sai, thoát lệnh sớm và vào lại với giá kém hơn.
Chỉ báo này được xây dựng dựa trên một giả thuyết khác.
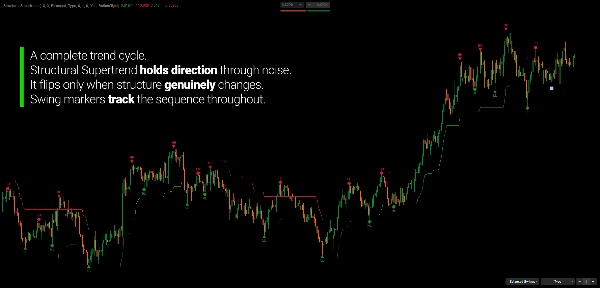
Hướng chỉ thay đổi khi giá xác nhận một sự chuyển đổi cấu trúc thực sự — không chỉ là một lần đóng cửa tạm thời vượt ngưỡng. Kết quả là ít đảo chiều giả hơn và phù hợp hơn với cách các xu hướng thực sự phát triển.
Supertrend trở nên có cấu trúc. Các tín hiệu trở nên có ý nghĩa.
TẠI SAO LẠI LÀ STRUCTURAL SUPERTREND?
Vấn đề
Supertrend gốc coi mỗi lần đóng cửa vượt dải là một sự đảo chiều. Điều này là có chủ ý — nó làm cho chỉ báo phản ứng nhanh theo thiết kế. Nhưng sự phản ứng nhanh đi kèm với một cái giá phải trả.
Trong các giai đoạn tích lũy, giá thường xuyên đóng cửa vượt một dải rồi ngay lập tức đảo chiều. Mỗi lần như vậy tạo ra tín hiệu đảo chiều, mỗi tín hiệu là một quyết định giao dịch tiềm năng, và mỗi tín hiệu là một lần thoát khỏi vị thế không cần thiết.
Các nhà giao dịch đã sử dụng Supertrend đủ lâu đều hiểu rõ sự khó chịu này.
Giải pháp
Structural Supertrend mở rộng mô hình gốc để phân biệt giữa các lần đóng cửa do biến động và các thay đổi hướng đi thực sự. Nó lọc bỏ nhiễu bằng cách yêu cầu xác nhận cấu trúc trước khi thay đổi hướng xu hướng.
Ít đảo chiều hơn. Phù hợp xu hướng tốt hơn. Ít phản ứng với từng cây nến riêng lẻ.
Tại sao giữ cả hai?
Supertrend gốc vẫn xuất hiện trên biểu đồ — nhưng chỉ ở những nơi nó khác với Structural. Thiết kế này là có chủ ý.
- Structural theo dõi hướng xu hướng chính
- Original tiết lộ hành vi xung lực và điều chỉnh trong xu hướng đó
Khi cả hai đồng thuận: sự tin tưởng hướng đi mạnh mẽ. Khi chúng khác nhau: động thái có khả năng là điều chỉnh, không phải đảo chiều thực sự. Cái nhìn hai lớp này cung cấp bối cảnh mà không một đường nào có thể cung cấp riêng lẻ.
PHÁT HIỆN SWING TÍCH HỢP
Structural Supertrend bao gồm một hệ thống phát hiện swing và khung S/R đầy đủ — không phải như một tính năng phụ, mà là một phần mở rộng trực tiếp của phân tích cấu trúc.
Các swing được xác định thông qua quá trình đánh giá ưu tiên cấu trúc: mỗi ứng viên được đánh giá dựa trên sự dịch chuyển, xác nhận khối lượng và khoảng cách tương đối ATR trước khi được chấp nhận. Điều này giữ cho bản đồ swing tập trung vào các điểm xoay có ý nghĩa thay vì mọi cực trị cục bộ.
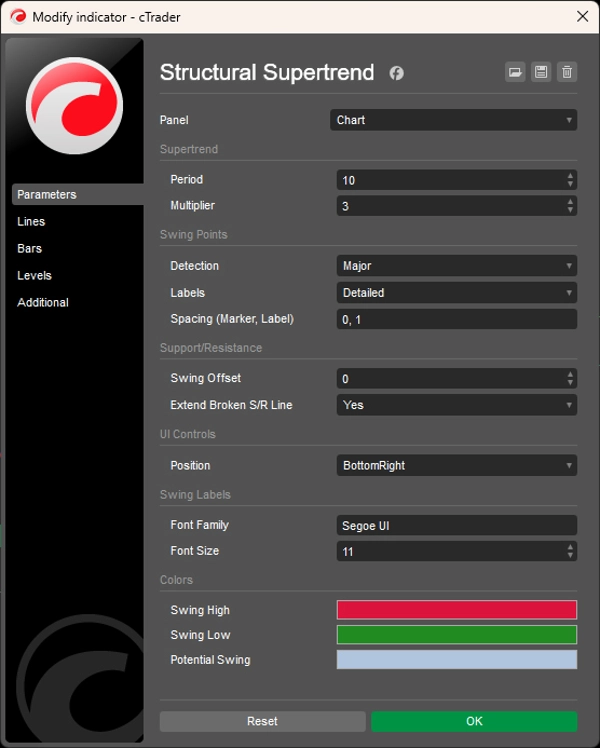
Ba chế độ phát hiện
- Nhỏ — tăng độ nhạy, bắt các swing bên trong xu hướng
- Cân bằng — độ chi tiết được lọc, phù hợp nhất cho hầu hết các trường hợp sử dụng
- Lớn — chỉ các điểm xoay cấu trúc mạnh nhất, được xác nhận bởi các tiêu chí rộng hơn
Phân loại sức mạnh Swing
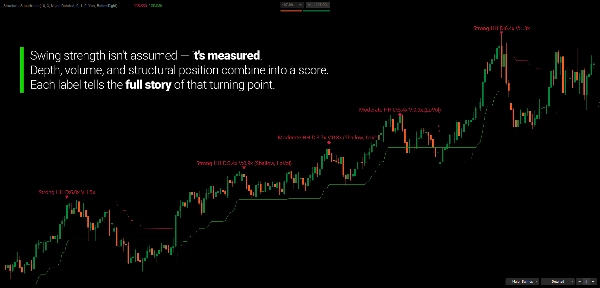
Mỗi swing được xác nhận được đánh giá dựa trên độ sâu, khối lượng và vị trí cấu trúc so với swing trước đó cùng loại. Sức mạnh được phân loại động dựa trên xếp hạng phần trăm trong lịch sử swing gần đây — không phải ngưỡng cố định. Các dấu hiệu trực quan phản ánh phân loại: tam giác cho mạnh, kim cương cho trung bình, vòng tròn cho yếu.
Vùng S/R với theo dõi cực tính
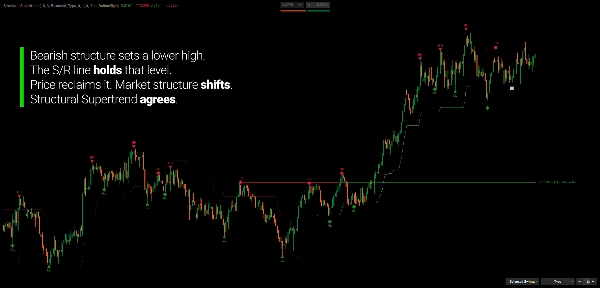
Các swing được xác nhận trở thành các mức S/R hoạt động theo dõi lịch sử tương tác của chính chúng. Khi giá quay lại một mức, chỉ báo ghi lại liệu tiếp xúc là sự từ chối bằng bấc hay phá vỡ thân nến. Khi một mức bị quét và đóng cửa vượt qua nó, cực tính đảo chiều — kháng cự trước đây trở thành hỗ trợ, và ngược lại. Nếu bị quét lại, vùng đó bị vô hiệu hóa.
Nhãn tuổi cho biết mức đó đã hoạt động bao lâu và đã được thử nghiệm bao nhiêu lần.
ĐỌC BIỂU ĐỒ
- Đường cấu trúc màu xanh lá: Xu hướng cấu trúc tăng (hỗ trợ động)
- Đường cấu trúc màu đỏ: Xu hướng cấu trúc giảm (kháng cự động)
- Đường chấm: Supertrend gốc — chỉ hiển thị ở nơi khác với Structural
- Đường S/R: Các mức hoạt động với trạng thái cực tính và tuổi
Kiểm tra sự phù hợp xu hướng:
- Cấu trúc + Gốc đồng thuận → Di chuyển hướng có độ tin cậy cao
- Cấu trúc + Gốc khác nhau → Có khả năng là giai đoạn điều chỉnh hoặc chuyển tiếp
DÀNH CHO AI
Chỉ báo này dành cho các nhà giao dịch muốn đọc hướng xu hướng và cấu trúc thị trường từ một khung phân tích duy nhất, mạch lạc.
Nếu bạn đã sử dụng Supertrend cổ điển và thấy nó phản ứng quá nhanh — thường xuyên đảo chiều trong điều kiện đi ngang — Structural Supertrend được xây dựng để giải quyết chính vấn đề đó.
Nó phù hợp cho nhà giao dịch theo xu hướng và swing muốn có cái nhìn hướng đi sạch hơn mà không bị đảo chiều giả liên tục, nhà giao dịch dựa trên cấu trúc theo dõi chuỗi swing để xác nhận sức khỏe xu hướng, và nhà giao dịch tùy ý sử dụng các mức S/R làm bối cảnh cho việc vào lệnh, thoát lệnh và quản lý vị thế.
Các điều khiển giao diện tích hợp làm cho nó thực tế để sử dụng trong thời gian thực: chuyển đổi chế độ phát hiện, điều chỉnh tham chiếu S/R, và bật tắt chi tiết nhãn trực tiếp trên biểu đồ — không cần mở bảng cài đặt.
Đây không phải là bộ tạo tín hiệu. Nó là một khung phân tích cấu trúc dành cho các nhà giao dịch muốn hiểu thị trường đang ở đâu, không chỉ là nó đang làm gì ngay bây giờ.
ĐIỀU GÌ LÀM NÓ KHÁC BIỆT
Hầu hết các triển khai Supertrend coi mỗi lần đóng cửa vượt dải là có thể hành động. Cái này coi đó là ứng viên — và yêu cầu bằng chứng cấu trúc trước khi cam kết thay đổi hướng.
Hầu hết các bộ phát hiện swing xác định các đỉnh và đáy cục bộ mà không có tiêu chí đánh giá. Cái này đánh giá mỗi swing dựa trên dịch chuyển, khối lượng và vị trí cấu trúc — và đánh giá sức mạnh một cách động dựa trên lịch sử swing gần đây.
Hầu hết các công cụ S/R chỉ vẽ một đường rồi để đó. Cái này theo dõi lịch sử tương tác, đánh dấu thay đổi cực tính, và tiếp tục phát triển khi thị trường quay lại từng mức.
Kết quả: một công cụ xu hướng và cấu trúc giữ được tính liên quan lâu hơn, ít phản ứng với nhiễu hơn, và xây dựng bức tranh phong phú hơn về điều kiện thị trường theo thời gian.
---
HIỂU PHÂN TÍCH CẤU TRÚC
Cấu trúc thị trường không phải là tìm swing "đúng" hay hướng xu hướng "chính xác". Nó là duy trì một bức tranh khách quan về cách các chuỗi giá đang phát triển — và liệu chuỗi đó còn mạch lạc hay bắt đầu suy giảm.
Một xu hướng được định nghĩa không phải bởi một động thái đơn lẻ mà bởi một chuỗi các mối quan hệ: đỉnh cao hơn và đáy cao hơn trong xu hướng tăng, đỉnh thấp hơn và đáy thấp hơn trong xu hướng giảm. Mỗi swing mới hoặc xác nhận hoặc thách thức chuỗi hiện tại. Khi xác nhận tiếp tục, cấu trúc còn nguyên vẹn. Khi nó bị phá vỡ, cấu trúc đang chuyển đổi.
Điều làm cho phân tích cấu trúc hữu ích không phải là nó dự đoán giá sẽ đi đâu, mà là nó mô tả giá đang ở đâu trong chuỗi của chính nó. Sự khác biệt này quan trọng. Dự đoán đòi hỏi giả định về tương lai. Quan sát cấu trúc chỉ cần đọc chính xác những gì đã xảy ra.
Các chỉ báo xây dựng trên logic cấu trúc được thiết kế để hỗ trợ quan sát đó — làm cho chuỗi có thể nhìn thấy và theo dõi mà không đưa vào diễn giải chủ quan. Mục tiêu là sự rõ ràng về điều kiện thị trường hiện tại, không phải sự chắc chắn về hướng giá tương lai.
---
Giao dịch có rủi ro. Chỉ báo này là công cụ phân tích kỹ thuật — luôn áp dụng quản lý rủi ro phù hợp.
Tóm tắt
Đánh giá của khách hàng
5 | 67 % | |
4 | 33 % | |
3 | 0 % | |
2 | 0 % | |
1 | 0 % |


